

Market Overview
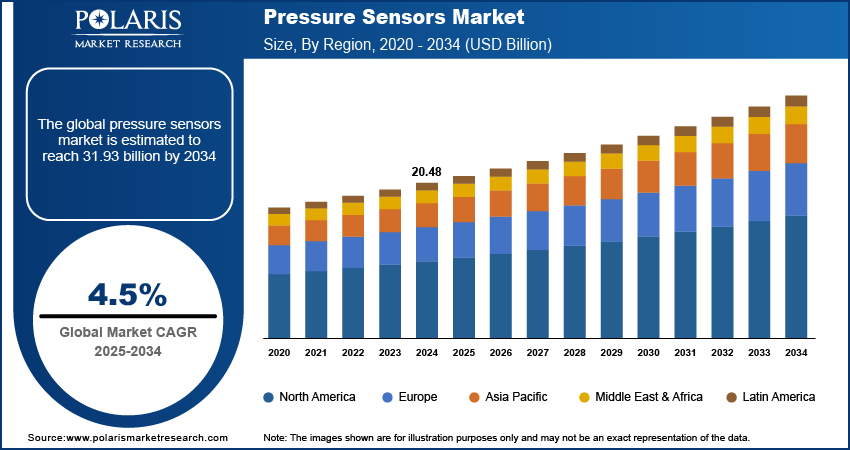
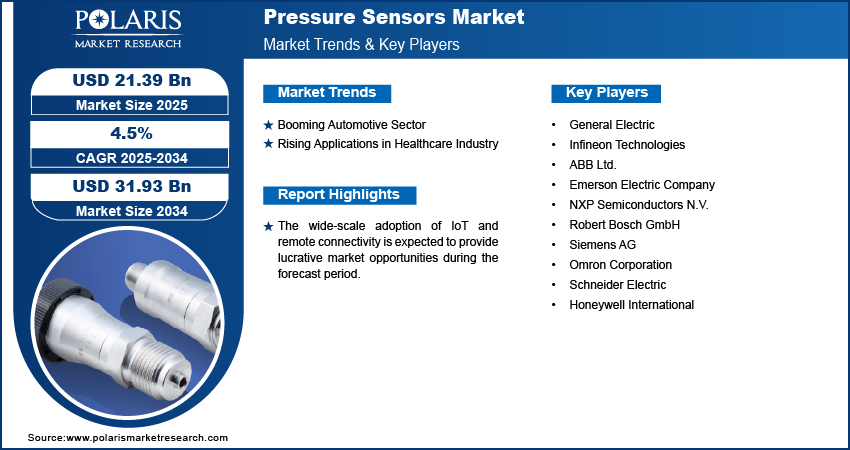
The global pressure sensors market size stood at USD 21.38 billion in 2025. The market is projected to account for a CAGR of 4.5% between 2026 and 2034.
Pressure sensors are transducers that measure pressure in gases or liquids. These sensors measure the capacitance and determine the actual pressure. Pressure sensors are categorized as different types depending on the principle or technology used to measure the pressure. These types are capacitive pressure sensors, piezoelectric pressure sensors, piezoresistive pressure sensors, and differential pressure sensors. Pressure sensors are increasingly being used in Industry 4.0, smart manufacturing, and IIoT (Industrial Internet of Things) applications, where real-time monitoring is critical.
Key Insights
- The absolute pressure sensors segment led the market with a 35.64% revenue share in 2025. This is due to the widespread use of absolute pressure sensors in various applications.
- The electromagnetic segment is projected to register the highest CAGR from 2026 to 2034. The increased focus on the capacity of electromagnetic pressure sensors to convert pressure into electricity is expected to drive the demand for these sensors in the electrical sector.
- Asia Pacific led the market with a 49.80% revenue share in 2025. The rising focus on automation and the growing demand in emerging markets contribute to the region’s leading market position.
- The North America pressure sensors market is projected to account for a significant growth rate. This is due to the strong demand for pressure sensors in aerospace systems and automotive safety technologies.
Industry Dynamics
Drivers
- Increase in the use of MEMS pressure sensors due to their compact size and cost-effectiveness
- Rising demand from electric vehicles and automotive safety systems like ADAS
- Increasing use in smart manufacturing and Industry 4.0
Restraints
- Need to meet stringent safety and regulatory requirements
- Performance issues in extreme conditions
Opportunities
- Expansion of IIoT and predictive maintenance
- Growing demand for wearable medical devices and remote monitoring
- Increased use in consumer electronics, such as barometric and altimeter pressure sensors
Challenges
- Pricing pressure due to strong competition
- Difficulty in integrating with advanced industrial systems
Market Statistics
2025 Market Size: USD 21.38 billion
2034 Projected Market Size: USD 31.76 billion
CAGR (2026–2034): 4.5%
Asia Pacific: Largest Market in 2025
AI/Gen AI Impact on Pressure Sensors Market
- AI helps pressure sensors give more accurate data by quickly noticing small changes and patterns.
- AI helps pressure sensors detect faults early, reducing the risk of costly maintenance.
- AI makes pressure sensors more useful in smart systems, like automated factories and connected devices.
- It assists with better decision-making by turning data into easy-to-understand information.
- AI and Gen AI are supporting applications such as smart tire pressure monitoring systems (TPMS) and respiratory monitoring in healthcare. They are also assisting with pipeline leak detection and fluid control in robotics. These technologies are making operations safe and efficient across industries.
The latest advancements in pressure sensing technologies are being combined with micro-electro-mechanical systems (MEMS), wireless technology, and IoT platforms. These are allowing real-time monitoring in various industrial systems. Pressure sensors are being increasingly used in automotive safety, medical devices, smart manufacturing, and consumer electronics. This adoption is contributing to the market development. This trend also supports predictive maintenance. Here, pressure data is used to detect problems earlier, reducing downtime in industrial processes.
The pressure sensors market is witnessing advancements in smaller sensors, smart pressure sensors, AI-based diagnostics, and semiconductor sensing components. This is expanding their use in advanced areas such as electric vehicles, aerospace systems, and remote industrial monitoring. The introduction of favorable government regulations to promote the use of pressure sensors is expected to create lucrative opportunities for the pressure sensor market during the forecast period.
To Understand More About this Research:Request a Free Sample Report
Market Dynamics
Booming Automotive Sector
Several factors, such as increased demand for vehicles, technological advancements, and new safety/emission standards, are driving the growth of the automotive industry. As the automotive industry is becoming highly innovative, the focus is on developing electric vehicles as well as autonomous vehicles, which is leading to an increase in the overall investments in R&D activities. Therefore, the demand for various automotive parts, including pressure sensors, which are used in ADAS (advanced driver assistance systems), tire pressure monitoring systems (TPMS), battery management, as well as fuel injection, is increasing significantly. Thus, the growing automotive sector across the world fuels the automotive pressure sensors market demand.
Rising Applications in Healthcare Industry
Pressure sensors are used in many medical devices, such as infusion pumps, blood pressure monitors, and ventilators, where accurate pressure measurement is critical to patient safety and health. The usage of pressure sensors has also enabled the development of portable medical devices. The use of miniaturized pressure sensors in wearable health devices, smart medical implants, and remote patient monitoring systems is likely to drive growth in the healthcare pressure sensors market. The need to monitor accurately and the use of telemedicine are also contributing to the increased adoption of pressure-sensing technology in healthcare systems. The growing use of medical wearable devices and remote patient monitoring systems is creating a need for compact and highly sensitive pressure sensors.
Industry 4.0 & Predictive Maintenance
Pressure sensors play a key role in Industry 4.0 and smart manufacturing. In smart manufacturing, where machines are interconnected, pressure sensors help monitor machine performance in real time. In this way, predictive maintenance is achieved, enabling the anticipation of future problems with machines. Predictive maintenance is reducing downtime and maintenance costs. The integration with IIoT platforms is helping industries become more efficient and reliable.
Segment Insights
Market Outlook by Type Insights
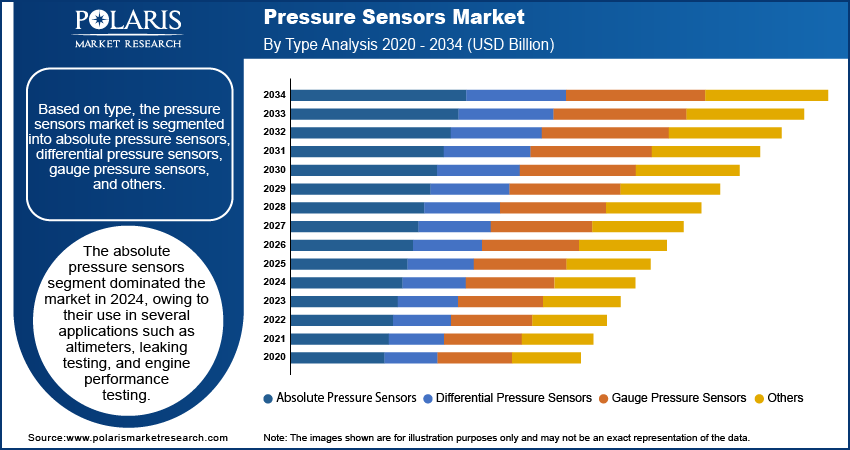
The pressure sensors market segmentation, based on type, includes absolute pressure sensors, differential pressure sensors, gauge pressure sensors, and others. The absolute pressure sensors segment led the market with a 35.64% revenue share in 2025. These sensors give a pressure reading in reference to the reference pressure level. Additionally, these sensors are hermetically sealed for the purpose of maintaining the vacuum reference, thus ensuring precise pressure readings. There are various uses of absolute pressure sensors. These include weather forecasting systems, aviation altimeter systems, leak test systems, and engine performance test systems. These sensors are also used in sealed pressure sensor applications and vacuum-based systems that require maintaining a stable reference. There is increased demand for high-precision engine monitoring and aircraft altitude measurement systems. The need for industrial gas monitoring applications is also on the rise. This further contributes to the usage of absolute pressure sensors across several sectors.
Market Assessment by Technology Insights
The pressure sensors market, based on technology, is segmented into optical, piezoresistive, electromagnetic, capacitive, resonant solid-state, and others. The piezoresistive segment led the market in 2025. The growing use of piezoresistive sensors in passenger vehicles for improved vehicle safety and better emissions contributes to the segment’s dominance. Piezoresistive sensors are robust and have a rapid response time. Their high frequency makes them useful in several industrial and aerospace applications. There is an increased emphasis among manufacturers on the development of waterproof sensors that can resist external disturbances, further contributing to the segment’s leading market position.
The electromagnetic segment is anticipated to witness the highest growth rate from 2026 to 2034. The increased focus on the capacity of electromagnetic pressure sensors to convert pressure into electricity is expected to drive the demand for these sensors in the electrical sector. Improvements in the manufacturing of semiconductors and the sensing of materials at the nano level are helping companies develop pressure sensors with increased accuracy, durability, and resistance to temperature variations. This pressure sensor technology is increasingly used in the automotive and aerospace industries.
MEMS Pressure Sensors: Technology Overview and Market Role
The micro-electro-mechanical systems (MEMS) pressure sensors are becoming one of the most important technologies in the market. The sensors are small in size, energy-efficient, and can be easily integrated into electronic devices. MEMS technology supports miniaturisation. This enables them to be used in various devices such as smartphones, automobiles, and industrial equipment.
There is increased demand for small and cost-effective sensors. This is driving the usage of MEMS pressure sensors in different industries. They are energy-efficient and can provide accurate data. It makes them ideal for modern computer systems.
Pressure Range Classification and Applications
|
Pressure Range |
Key Applications |
Demand Trend |
|
Up to 100 psi |
Consumer electronics, medical devices, wearables |
High demand due to miniaturization |
|
101 to 1000 psi |
Automotive systems, HVAC, industrial automation |
Steady demand from various industries |
|
Above 1000 psi |
Oil & gas, heavy machinery, aerospace |
Increasing demand from high-pressure applications |
Pricing / ASP Trend Analysis
|
Sensor Type |
Average Price Range |
Trend |
|
MEMS Pressure Sensors |
Low to medium |
Declining due to mass production |
|
Industrial Pressure Sensors |
Medium to high |
Stable pricing |
|
High-Precision Sensors |
High |
Premium due to accuracy |
Pressure sensor price is determined by various factors. The prices differ depending on the technology, precision, and application. The overall average selling price (ASP) of pressure sensors is gradually falling. The reason behind this is the advancement in semiconductor technology and the increase in competition. However, pressure sensors used in the medical and aeronautical industries have higher prices.
Regional Analysis
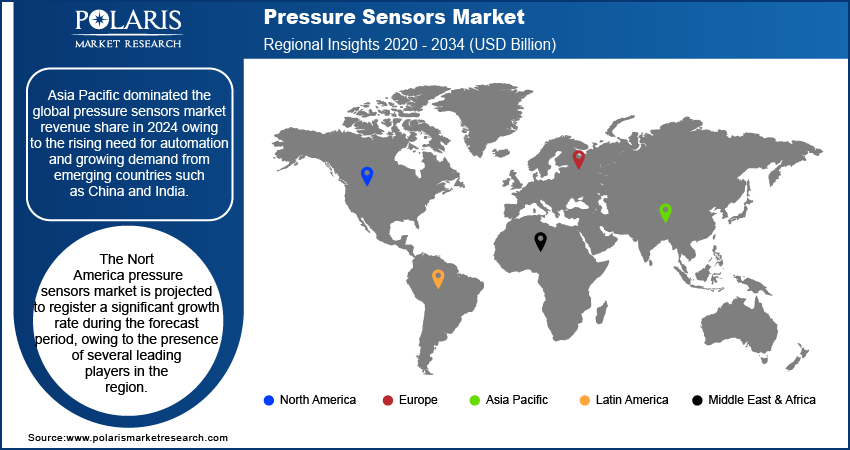
This pressure sensors regional analysis covers North America, Europe, Asia Pacific, Latin America, and the Middle East & Africa. Asia Pacific dominated the market with a 49.80% revenue share in 2025. The increasing focus on automation and the growing demand in emerging markets such as China, Japan, India, and South Korea are driving the Asia Pacific pressure sensors market. Favorable regulations implemented in the region are also boosting market growth for pressure sensors. Asia Pacific has a robust electronics manufacturing industry, semiconductor manufacturing, and large automotive centers, which are driving growth in the pressure sensors market in this region.
The North America pressure sensors market is projected to register a significant growth rate during the forecast period. This is due to the strong demand for pressure sensors in aerospace systems and automotive safety technologies. Pressure sensors are also being increasingly used in industrial automation solutions in the region. The increased demand for pressure sensors in tire pressure monitoring systems and exhaust gas recirculation systems is expected to boost the market growth. The presence of key players is another factor expected to contribute to the regional market's growth.
Supply Chain & Patent Landscape
The pressure sensors market relies on raw materials such as semiconductors, metals, and sensing elements. Supply chain analysis suggests that pressure sensors are becoming increasingly dependent on Asian hubs for semiconductor production.
Companies are also investing in innovation. There is a growing activity in the patent landscape and IP development related to MEMS technology, sensor accuracy, and miniaturization. For trade and procurement data monitoring, pressure sensors fall under HS code 902620.
Key Players and Competitive Insights
The pressure sensors market is highly competitive with many global manufacturers and specialized sensor companies. The key players are focusing on developing innovative products, developing MEMS technology, and enhancing semiconductor manufacturing.
The companies are also focusing on developing partnerships and acquiring businesses to enhance their technological capabilities and expand their global footprint. Acquisitions of businesses in sensor technology and semiconductor manufacturing are emerging as key strategies to expand the market.
To thrive in the competitive market environment, companies deliver pressure sensors that are efficient and cost-effective. A few of the key players in the market are General Electric, Infineon Technologies, ABB Ltd., Emerson Electric Company, NXP Semiconductors N.V., Robert Bosch GmbH, Siemens AG, Omron Corporation, Schneider Electric, and Honeywell International.
List of Key Companies
- ABB Ltd.
- Emerson Electric Company
- General Electric
- Honeywell International
- Infineon Technologies
- NXP Semiconductors N.V.
- Omron Corporation
- Robert Bosch GmbH
- Schneider Electric
- Siemens AG
Industry Developments
September 2025: Crane Company announced the acquisition of Precision Sensors & Instrumentation, a business of Baker Hughes, for USD 1.06 billion. The acquisition brings in USD 390 million in revenue, along with the addition of the Druck business, which specializes in pressure sensing for the aerospace industry.
February 2025: Honeywell International Inc. announced its partnership with ForwardEdge ASIC, a subsidiary of Lockheed Martin. The partnership aims to provide radiation-hardened microelectronics that can be used in space. Honeywell and ForwardEdge will combine their resources to provide ASICs and memory products.
February 2025: Infineon was granted EU funding of about EUR 1 billion under the European Chips Act to support the Smart Power fab in Dresden. This will boost semiconductor production capacity for the automotive, industrial, and security markets, as well as support the development of sensors and generate up to 1,000 new jobs.
January 2025: Infineon formed a new business unit, SURF (Sensor Units & Radio Frequency), which is aimed at strengthening the company’s sensor and RF business. This is in line with R&D and cost synergies in the growing green energy, mobility, and IoT markets.
January 2024: ABB announced the acquisition of Real Tech, a Canadian firm specializing in optical sensor technologies. This will enable ABB to increase its footprint in the smart water management business.
Pressure Sensors Market Segmentation
By Connectivity Outlook (Revenue, USD Billion, 2021–2034)
- Wired Sensors
- Wireless Sensors
By Type Outlook (Revenue, USD Billion, 2021–2034)
- Absolute Pressure Sensors
- Differential Pressure Sensors
- Gauge Pressure Sensors
- Others
By Technology Outlook (Revenue, USD Billion, 2021–2034)
- Optical
- Piezoresistive
- Electromagnetic
- Capacitive
- Resonant Solid-State
- Others
By Pressure Range Outlook (Revenue, USD Billion, 2021–2034)
- Up to 100 psi
- 101 to 1000 psi
- Above 1000 psi
By End-Use Industry Outlook (Revenue, USD Billion, 2021–2034)
- Automotive
- Healthcare
- Aviation
- Consumer Electronics
- Oil & Gas
- Industrial
- Others
By Regional Outlook (Revenue, USD Billion, 2021–2034)
- North America
- US
- Canada
- Europe
- Germany
- France
- UK
- Italy
- Spain
- Netherlands
- Russia
- Rest of Europe
- Asia Pacific
- China
- Japan
- India
- Malaysia
- South Korea
- Indonesia
- Australia
- Vietnam
- Rest of Asia Pacific
- Middle East & Africa
- Saudi Arabia
- UAE
- Israel
- South Africa
- Rest of Middle East & Africa
- Latin America
- Mexico
- Brazil
- Argentina
- Rest of Latin America
Pressure Sensors Market Report Scope
|
Report Attributes |
Details |
|
Market Size in 2025 |
USD 21.38 billion |
|
Market Size in 2026 |
USD 22.33 billion |
|
Revenue Forecast by 2034 |
USD 31.76 billion |
|
CAGR |
4.5% |
|
Base Year |
2025 |
|
Historical Data |
2021–2024 |
|
Forecast Period |
2026–2034 |
|
Quantitative Units |
Revenue in USD billion, and CAGR from 2026 to 2034 |
|
Report Coverage |
Revenue Forecast, Market Competitive Landscape, Growth Factors, and Trends |
|
Segments Covered |
|
|
Regional Scope |
|
|
Competitive Landscape |
Pressure Sensors Industry Trend Analysis (2025) Company profiles/industry participants profiling include company overview, financial information, product/service benchmarking, and recent developments |
|
Report Format |
PDF + Excel |
|
Customization |
Report customization as per your requirements with respect to countries, regions, and segmentation. |
FAQ's
The pressure sensors market stood at USD 21.38 billion in 2025. The market is projected to reach USD 31.76 billion by 2034.
Pressure sensors are devices that measure the pressure of gases or liquids in various systems. Pressure sensors are commonly used in car engine systems, industrial automation systems, medical devices, and space technology systems.
The market for pressure sensors is projected to account for a CAGR of 4.5% between 2026 and 2034.
Major industries using pressure sensors include automotive, healthcare, oil and gas, aerospace, consumer electronics, and industrial automation.
MEMS pressure sensors are micro-electromechanical devices that use mechanical elements, miniaturized with semiconductor electronics, to sense pressure.
Asia Pacific leads the market for pressure sensors. This is due to the region’s strong electronics manufacturing and automotive production sectors.
A few of the key players in the pressure sensors market are General Electric, Infineon Technologies, ABB Ltd., Emerson Electric Company, NXP Semiconductors N.V., Robert Bosch GmbH, Siemens AG, Omron Corporation, Schneider Electric, and Honeywell International.
The different pressure sensor types include capacitive pressure sensors, piezoelectric pressure sensors, piezoresistive sensors, and differential pressure sensors.
Pressure sensors are important in automotive systems to improve safety and fuel efficiency. They are also needed to monitor engine performance in real-time.
Smart pressure sensors are advanced devices that consist of a sensing element and integrated electronic circuitry (a microprocessor) that measure pressure and communicate the output.
Page last updated on:
Mar-2023
Research Methodology
A robust system of research, verification, and forecasting designed to ensure reliable and actionable market insights.
Polaris Market Research uses a clear and structured approach to deliver insights that clients can rely on. The process combines detailed primary and secondary research, including direct communication with industry experts. The detailed information helps build a complete picture of market trends and developments. Secondary data is gathered from credible sources such as industry reports, company filings, government source links, and trusted organization databases. It is then cross-checked through discussions with key stakeholders across the value chain. Market size and forecasts are developed using both bottom-up and top-down methods to ensure accuracy and consistency in the final results.

Project Setup
Step 1 & 2:
- We start every project by clearly understanding the client’s objective or goal, then defining the market scope, and aligning regions, segments, and timelines.
- Once the foundation is set, we collect data from all-around of sources, including company reports, government databases, and paid industry platforms.
- Our research is based on secondary data, which helps us build a strong understanding of the market across regions and industries. Then we validate this information through primary research by speaking directly with industry experts, companies, and stakeholders.
- By combining secondary and primary research, we ensure that our market insights are accurate, practical, and closely aligned with real market conditions.
Data Collection
We gather information from both public and verified sources:

Data Structuring
Step 3:
- All collected data is organized into a consistent format to ensure accurate analysis. Since inputs come from multiple sources, they are standardized and aligned before use.
- The data is segmented by product, application, and region, and mapped across a defined historical period (2020–2024). All values are converted into common units (USD Mn/Bn), and volume and pricing are aligned where required to estimate revenue.
- Any overlaps or inconsistencies are reviewed and adjusted to maintain accuracy (<5% variance threshold).
- The result is a structured dataset that allows for clear comparison across regions and supports reliable analysis and forecasting.
Structured Market Dataset, USD Mn/Bn

4. Data Structuring
Step 4: TOP-DOWN APPROACH
- We start with the overall market size at a global or macro level.
- The market is then narrowed down based on scope and industry relevance.
- We apply penetration rates and split the data by region and segment.
- This helps us estimate the market size for specific segments.
- The numbers are validated through cross-checks to ensure accuracy.

Step 5: BOTTOM-UP APPROACH
- We begin by analyzing data from leading companies in the market.
- Revenue data is collected and mapped across different segments.
- The data is then aggregated to estimate the total market size.
- To fill in any gaps, adjustments are made based on industry standards.
- Validation checks make sure that the results are correct.

5. Data Structuring
Step 6:
At Polaris Market Research, we employ a methodical forecasting strategy. This approach blends the analysis of historical data with real-time market validation. To forecast future trends with precision, we examine past patterns, pricing fluctuations, and the interplay of supply and demand. To ensure our conclusions reflect the present market landscape, we actively seek input from industry experts and key stakeholders.
To refine our predictions, we carefully consider critical elements such as market drivers and restraints, fluctuations in raw material costs, emerging technologies, and the production capabilities of various regions. Furthermore, we assess regulatory frameworks and potential policy shifts to gauge their potential impact on market expansion.
All this information is synthesized to generate precise forecasts for each segment and region. These forecasts illuminate the current state of the market and highlight forthcoming opportunities.

6. Data Structuring
Step 7:
In the final stage, we validate all our estimates using a triangulation method, where data is cross-checked from multiple reliable sources, like company data, primary interviews, and secondary research. This helps us make sure that our numbers are correct and fit with the rest of the market.
This process involves verifying data consistency across various segments and geographic areas. It also requires comparing historical trends with the assumptions support the forecast. Any discrepancies involve adjustments to ensure everything remains aligned and dependable.
Once the data is finalized, we prepare the final outputs, including market size estimates, segment-wise breakdowns, and growth metrics. These are delivered in structured formats such as tables, charts, and data files for easy analysis and use.
We collaborate closely with clients, ensuring the final products align with their requirements. This includes offering tailored adjustments, supplementary data analyses, and continuous assistance. Furthermore, we monitor market trends post-delivery, providing updates and refinements to maintain the insights' relevance as time passes.
Post-delivery, we continue to monitor market shifts, offering updates and adjustments to ensure the insights remain relevant over time.
Validation
Triangulation Framework
- Company-level data
- Primary inputs from industry participants
- Secondary benchmarks and published data
- Variance maintained within ±5-10%
- Adjustments applied to align estimates
- Segment values validated against overall market structure
Quality Check
Data Consistency & Integrity
- Segment totals validated to 100%
- Regional estimates aligned with global market size
- Historical trends compared against forecast outputs
- Assumptions reviewed for cross-segment and regional alignment
Output & Delivery
Final Outputs
- Market size estimates (USD Mn/Bn)
- Segment-wise distribution (%)
- Growth metrics (CAGR %)
- Structured tables and charts
- Segment-level datasets
- Excel-based data files for further analysis
Client Alignment & Support
- Deliverables are aligned with defined client requirements and scope
- Custom data cuts and segment splits are incorporated as required
- Post-delivery queries are addressed through analyst interactions
- Additional clarifications and data support are provided upon request
Client Continuity & Updates
- Market developments are tracked post-delivery to capture changes in key trends
- Updated data and revisions are provided based on new market inputs
- Additional refinements and data cuts are shared as required
- Continued analyst engagement supports evolving client requirements
