
Public Transportation Market Size, Share Global Analysis Report, 2025-2034
REPORT DETAILS
What is Public Transportation Market Size?
The global public transportation market was valued at USD 252.79 billion in 2024 and is expected to grow at a CAGR of 7.7% during the forecast period. The growth is driven by government initiatives, efforts to reduce traffic congestion, and cost advantage of using mass transit
Key Insights
- The road transportation segment dominated in 2024 due to increasing population, expanding transport infrastructure, rising disposable incomes.
- The online segment is expected to witness fastest growth during the forecast period as rapid global urbanization has created a pressing demand for enhanced public transportation systems.
- North America dominated with largest share in 2024 due to rising demand for affordable public transportation.
- Asia Pacific is projected to accounted for a significant share in the global market due to stringent emission regulations, supportive government policies, and the development of charging infrastructure.
Industry Dynamics
- The cost advantage of using mass transit over owning and operating a car is fueling the growth.
- The government initiatives is driving the growth.
- The efforts to reduce traffic congestion is boosting the growth.
- High infrastructure costs and limited funding for modernization is limiting the growth of the industry.
Market Statistics
- 2024 Market Size: USD 252.79 Billion
- 2034 Projected Market Size: USD 528.53 Billion
- CAGR (2025-2034): 7.7%
- Largest Market: North America
Source: Polaris Market Research Analysis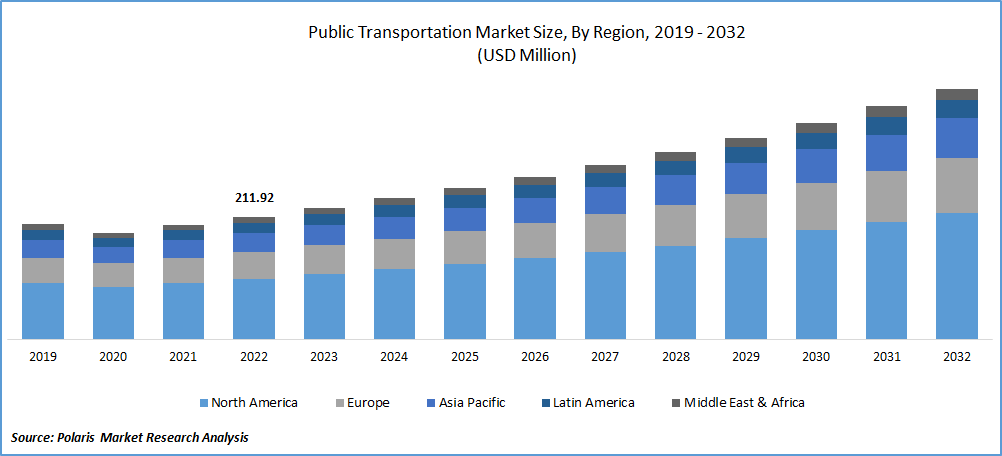
To Understand More About this Research: Download Sample Report
Traffic congestion is a major global issue due to the increase in private vehicles and urbanization. To address this problem, government authorities and travel agencies are promoting public transportation. Solving traffic congestion requires a multifaceted approach, such as promoting rail and metro systems, integrating urban planning, reforming urban development policies, and implementing intelligent transportation systems. Cities are making significant efforts to enhance public transportation by developing infrastructure, introducing new mobility options, improving travel comfort, ensuring environmental safety, and optimizing freight logistics. By prioritizing public transportation, local authorities can mitigate the impact of traffic congestion on modern roads. Reducing traffic congestion and implementing government initiatives favor the growth of the market. Governments worldwide are devising strategies to encourage the widespread use of public transportation and prioritize deploying advanced technology, innovative financing options, institutional improvements, and enhancing the overall user experience to attract a larger consumer base toward public transport.
Public transportation in major countries such as India, and China faces significant challenges due to population growth, rising greenhouse gas emissions, deteriorating air quality, and severe traffic congestion. The government is investing heavily in developing smart cities with advanced public transportation infrastructure. As part of these initiatives, cities must construct efficient public transportation systems, promote urban mobility by fostering walkable localities, and offer various transportation options. This efforts are driving the demand for modern public transportation infrastructure.
Source: Polaris Market Research Analysis
Get Full Segment-Level Forecasts & Insights: Download Sample Report
Industry Dynamics
What Factors are Driving the Market Growth?
The cost advantage of using mass transit over owning and operating a car is a significant factor influencing people's preference for public transportation. Recognizing this, local governments actively involve elderly individuals in public transport to alleviate traffic congestion and improve overall public transportation systems. These efforts to engage elderly populations in public transportation contribute to the market's growth. By promoting the benefits of public transit and providing accessible and convenient options for senior citizens, local authorities aim to reduce private vehicle usage and the associated traffic congestion, ultimately enhancing the efficiency and popularity of public transportation services. Furthermore, to alleviate road traffic congestion, prioritize public safety, and address the adverse environmental impacts of carbon emissions, several governments are actively pursuing various initiatives driving the growth of the global market. Governments across different countries have recognized the significance of allocating budgetary resources toward developing public transportation infrastructure and expanding and constructing new road networks. For example, the Colombian government recently redirected its national transportation budget to assist cities like Bogota and Medellin in enhancing their Bus Rapid Transit (BRT) and metro systems, respectively. These cities collectively serve approximately 300 million passengers on an annual basis.
Report Segmentation
The market is primarily segmented based on distribution channel, mode type, and region.
| By Distribution Channel | By Mode Type | By Region |
|
|
|
Source: Polaris Market Research Analysis
To Understand the Scope of this Report: Request Customization
Which Segment By Distribution Channel is Expected to Witness Fastest Growth?
Online segment is anticipated to be the fastest growing segment during the forecast period. The rapid global urbanization has created a pressing demand for enhanced public transportation systems. Currently, around 55% of the world's population resides in urban areas, projected to rise to around 68 per cent, by 2050, adding 2.5 Bn individuals to the urban populations, as per the United Nations. This significant influx of people is placing a strain on transportation and mobility infrastructures in cities that lack adequate public transport options and face safety issues on roads, ultimately leading to traffic congestion. In order to address this challenge, governing authorities are actively implementing digital transformation strategies that encompass the adoption of smart solutions and advanced online platforms. These measures are aimed at mitigating traffic congestion and improving the efficiency of transportation systems within urban areas.
Source: Polaris Market Research Analysis
Need Granular Data Across All Market Segments? Request Customization
Why Road Transportation Dominated with Largest Share in 2024?
The road transportation industry held largest market share in 2024 due to increasing population, expanding transport infrastructure, rising disposable incomes, and improved access to remote areas. Public transportation on roads also benefits the economy by supporting numerous roadside businesses affiliated with service providers. Governments also promote public transport to reduce excessive fuel consumption and mitigate pollution. This, combined with growing environmental consciousness among consumers, is driving the growth of this segment. Overall, the road transport segment is an increasingly attractive choice for commuters.
How North America Captured Largest Share in 2024?
The North American region dominated the market with largest share in 2024. This growth is driven by the rising demand for affordable public transportation solutions due to limited accessibility and high transportation costs in the region. The government has undertaken various investment initiatives to address this issue to provide affordable and accessible transportation facilities. For instance, the Federal Railroad Administration announced the Consolidated Rail Infrastructure and Safety Improvements grant program in June 2022. With a total value of USD 368 million, this program aims to fund 46 projects across 32 states and the District of Columbia. The investments are focused on modernizing the region's rail infrastructure and supporting supply chains. These factors collectively contribute to the growth of the public transportation market in the region.
What are the Reasons for Asia Pacific's Fastest Growth?
The Asia Pacific region is expected to emerge as the fastest-growing region with a healthy CAGR during the forecast period. This is primarily due to stringent emission regulations, supportive government policies, and the development of charging infrastructure. These factors have created a favorable environment for market growth in the region. Furthermore, the increasing pollution levels and the detrimental impact of greenhouse gas emissions on the environment have heightened the demand for environmentally friendly vehicles in the region. To promote green transportation, governments in various countries have implemented tax exemptions and subsidies to purchase electric buses. This initiative has significantly stimulated the manufacturing of electric buses, thereby driving the market growth in the region.
Source: Polaris Market Research Analysis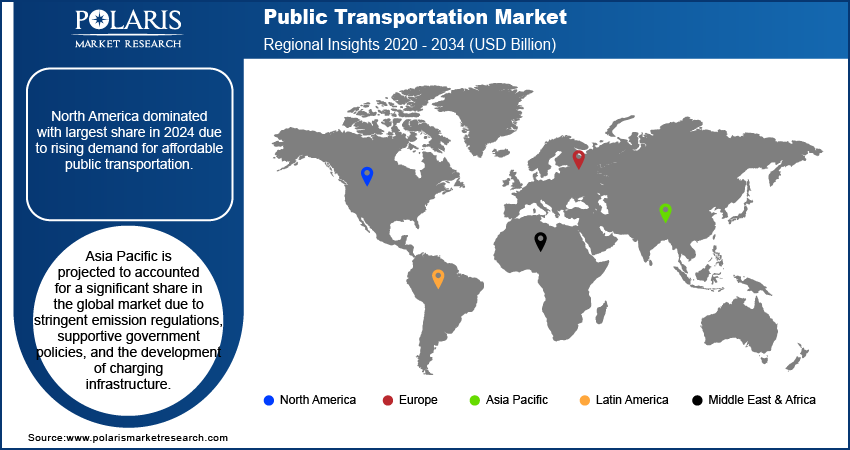
Curious About Regional Market Performance? Request Customization
Competitive Insight
- BC Transit Corporation
- Berliner Verkehrsbetriebe
- Deutsche Bahn
- East Japan Railway Company
- Keolis
- Mass Transit Railway
- Metropolitan Transportation Authority
- Southern California Regional Rail Authority (Metrolink)
- The Brussels Transport Company
- Transport for London (TfL)
- Transport International Holding
- Trenitalia c2c
- TOBU RAILWAY
- Toronto Transit Commission
- Transdev.
Recent Developments
- June 2025: Beep Inc. began operating the Jacksonville Transportation Authority’s fully autonomous NAVI shuttle service on public streets, marking a nationwide first.
- February 2025: The Metropolitan Transportation Authority placed a USD 1.1 billion order with New Flyer for 265 battery-electric buses, including depot chargers and 10 years of maintenance support.
- In February 2022, Transport for London (TfL) revealed a partnership with MTR Elizabeth Line and Walker Construction Limited to enhance accessibility and expand facilities at Burnham station. The planned improvements encompass the installation of new ticket vending machines, customer information screens, and automatic ticket gates and constructing of ticket office buildings with accessible ticket windows and automated ticket gates.
Public Transportation Market Report Scope
| Report Attributes | Details |
| Market size in 2024 | USD 252.79 billion |
| Market size in 2025 | USD 271.72 billion |
| Revenue forecast in 2034 | USD 528.53 billion |
| CAGR | 7.7% from 2025 – 2034 |
| Base year | 2024 |
| Historical data | 2020 – 2023 |
| Forecast period | 2025 – 2034 |
| Quantitative units | Revenue in USD billion and CAGR from 2025 to 2034 |
| Segments covered | By Mode Type, By Distribution Channel, By Region |
| Regional scope | North America, Europe, Asia Pacific, Latin America; Middle East & Africa |
| Key companies | BC Transit Corporation, Berliner Verkehrsbetriebe, Deutsche Bahn, East Japan Railway Company, Keolis, Mass Transit Railway, Metropolitan Transportation Authority, Southern California Regional Rail Authority (Metrolink), The Brussels Transport Company, Transport for London (TfL), Transport International Holding, Trenitalia c2c, TOBU RAILWAY, Toronto Transit Commission, and Transdev. |
Source: Polaris Market Research Analysis
Public Transportation Market FAQ's
The Public Transportation Market report covering key are distribution channel, mode type, and region.
Public Transportation Market Size Worth $ 528.53 Billion By 2034.
The global public transportation market expected to grow at a CAGR of 7.7% during the forecast period.
North America is Public Transportation Market.
key driving factors in Public Transportation Market are Cost advantage of using mass transit.
Download Sample Report of Public Transportation Market
Please fill out the form to request a customized copy of the research report.
