
Scooters Market Demand & Growth Analysis Report, 2026-2034
REPORT DETAILS
Scooters Market Summary
The Scooters Market is projected to be valued at USD 26.62 billion in 2025 and grow at a CAGR of 6.1% through 2034. Demand for urban mobility, rising fuel efficiency awareness, and the shift toward electric scooters are fueling market growth.
Market Statistics
Key Takeaways
- Asia Pacific dominated the global market with a 70.09% revenue share in 2025. The rising disposable incomes, along with the growing inclination toward personal vehicles, have propelled the regional market's dominance.
- North America is forecasted to record a rapid growth rate of 6.9% CAGR. The changing consumer inclination toward rental scooters rather than other two-wheelers is driving the regional market's growth.
- The normal scooter segment dominated the global market with a 68.30% market share in 2025. The rising consumer preference for comfort-based riding with gearless drivetrain vehicles is driving the segment's dominance.
- The electric scooters segment is forecasted to account for a significant CAGR of 6.5%. The growing consumer awareness of greenhouse gases and carbon emissions is driving the segment's growth.
- The swappable electric scooters segment is anticipated to register a high CAGR of 6.3%. This is attributed to the automotive industry's increasing involvement in battery swapping technology.
Industry Dynamics
- The growing preference for electric scooters due to their lightweight design and battery-powered functionality is contributing to the market growth.
- Increased urbanization and better road infrastructure in developing countries are fueling high demand for scooters.
- The growing use of scooters in business and last-mile deliveries is creating several opportunities.
- Safety issues and regulatory restrictions can constrain market development.
The increasing pace of urbanization and enhanced road connectivity in emerging economies has generated a significant demand for transportation. The lack of public vehicles in remote areas motivates consumers to invest in personal vehicles. There is a growing preference for lightweight, easy-to-drive, and cost-effective vehicles, making scooters a popular choice. Battery-powered electric scooters, which eliminate the need for fuel and contribute to reduced vehicular pollution, are driving the growth of the market.
Source: Polaris Market Research Analysis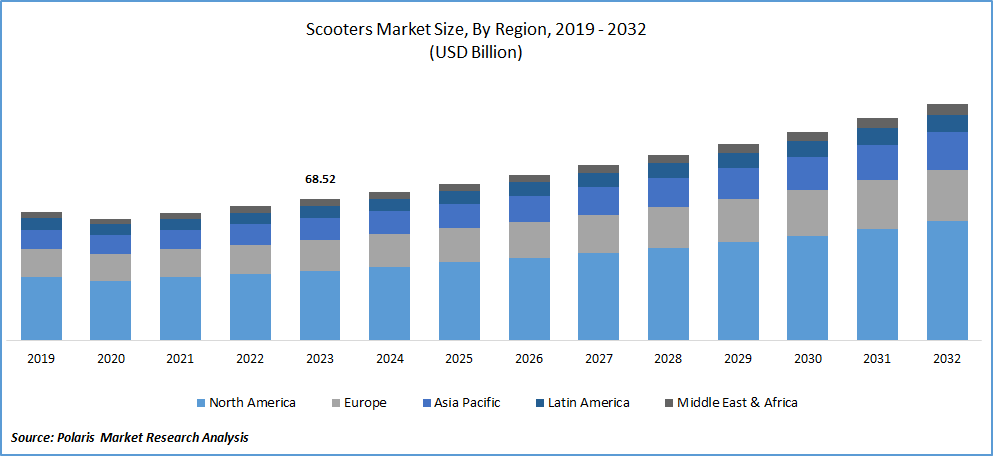
Want a Deeper Look at Key Market Players? Download Sample Report
The economic progress of a nation is closely tied to its road infrastructure. Governments in developing countries are actively investing in the construction of safe and efficient roads, creating new avenues for growth in the transportation and logistics sector. This has led to a surge in entrepreneurs entering the logistics market by establishing their firms or forming partnerships with existing ones. Consequently, there is a growing demand for vehicles that can swiftly transport goods with minimal time and cost, with scooters emerging as a preferred choice. Scooters offer the advantage of easy maneuverability through traffic and lower fuel consumption compared to bikes, mopeds, and cars.
Moreover, manufacturers of scooters are predominantly concentrating on integrating advanced technology into their vehicles to boost speed, improve battery efficiency, and enhance cost-effectiveness for consumers. Additionally, electric scooter manufacturers have launched a variety of scooter models in emerging economies. For example, in February 2022, Silence, a Spanish company, unveiled the Silence 01 and 02 models in South Africa, featuring fast charging capabilities, ample load-carrying capacity, and removable batteries. As a result, these strategies implemented by automakers are anticipated to generate fresh growth opportunities for scooters market.
Use Cases and Applications
The use of scooters in different applications depends on consumer requirements. For example, in cities, these vehicles help provide an affordable mode of transportation as they allow people to easily maneuver within the city. In addition, they are used in the delivery sector due to their fast delivery capability as they can maneuver through heavy traffic. They are even employed in the sector of shared transport services wherein these scooters are used for short distance travel within the city. Scooters are also useful for personal mobility in semi-urban and rural areas.
Benefits vs Challenges
Benefits
- Less expensive when compared to cars and bikes
- Maneuverable in traffic conditions
- Uses less fuel/energy than other means of transport
- Suitable for covering shorter distances
- Electric scooters contribute to reduced pollution
Challenges
- Shorter distance coverage
- Few charging facilities in certain areas
- Slow compared to bikes
Source: Polaris Market Research Analysis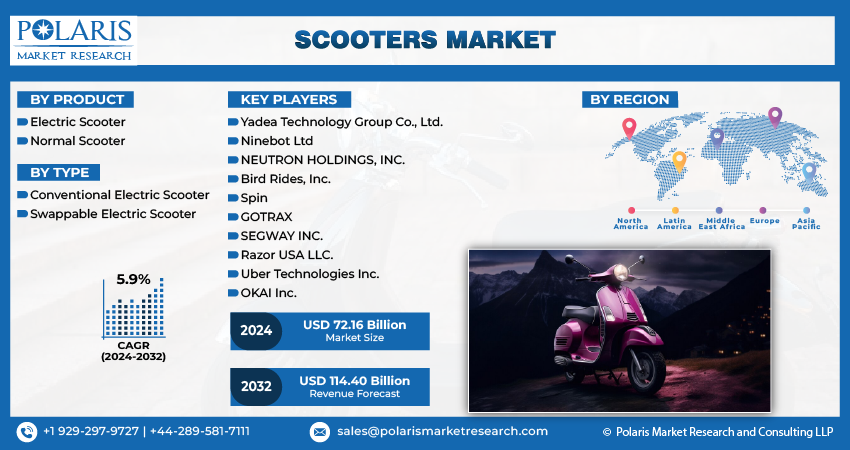
Get Full Segment-Level Forecasts & Insights: Download Sample Report
Industry Dnyamics
Rising Demand for Electric Scooters
Increasing adherence to regulatory standards, the prohibition of internal combustion engine (ICE) vehicles, reduced import duties on electric vehicles, and enhanced battery charging infrastructure have led to a shift in consumer preferences towards electric scooters as opposed to conventional ones. Electric scooters , known for their lightweight design, ease of operation, and battery-powered functionality, are becoming popular for short-distance travel and local sightseeing. The high mechanical efficiency, lower noise levels, reduced total cost of ownership, and lower maintenance requirements of electric scooters contribute to their growing demand. Additionally, the adoption of electric scooters for sharing services in developed countries is anticipated to drive market growth further.
Key Scooter Trends
| Trend | Description | Key Drivers | Examples from Practice |
| Electrification of two/three-wheelers | Shift to battery electric scooters (e2Ws) and three-wheelers, with sales surging in Asia; e2W sales share reaching 20-30% in China/India by 2024. | Policy incentives (e.g., FAME-II in India), falling battery prices, urban air quality mandates. | China: e2Ws >50% of scooter sales; India: high-speed e-scooters up 425% in 2021 under FAME-II subsidies up to USD 670. |
| Micromobility/shared e-scooters | Rise of dockless shared e-scooters for short urban trips (avg. 1-2 km), supporting last-mile connectivity. | Urban density, smartphone apps, pilot programs in 100+ US/EU cities. | US: 38M trips in 2018; rebound post-COVID with 1 in 3 trips new/recreational. |
| Safety regulations evolution | "Regulate-pilot-evaluate-revise" for e-scooters: speed limits (15-20 mph), helmet mandates, sidewalk bans. | Injury rates (e.g., ER visits up 425% for riders), sidewalk clutter. | Bike lanes reduce sidewalk riding; wider roads increase it; helmet use <2% observed. |
| Affordability via incentives | Subsidies closing upfront cost gap; TCO parity for e2Ws vs. ICE by 2030 in India/China. | Declining Li-ion prices (30% drop in China 2024), state EV policies. | India FAME-II: 1.5M+ subsidized e2Ws; Delhi incentives accelerate parity. |
| Integration with active/transit modes | E-scooters as first/last-mile feeders; substitutive for transit (esp. low-income/older users) or generative for recreation. | Multimodal apps, equity zones in pilots. | Tucson: 20-30% transit substitution (higher for >60yo/low-income); restaurant trips often new. |
| Infrastructure adaptations | Protected bike lanes prioritized; equity policies for low-income areas. | Non-optimal behaviors (e.g., sidewalk riding on wide roads). | SLC: Bike lanes cut sidewalk use; rail presence neutralizes effect. |
Source: Polaris Market Research Analysis
Technology and Trends
Advances in technology are playing a major role in the scooter industry. Electric scooters are increasingly becoming popular because of technological innovations, especially improvements in battery life made possible through the use of lithium-ion batteries. Besides, new technologies are being integrated into the design of electric scooters, like GPS systems, smartphone applications for communication and diagnostics, and even theft protection mechanisms. Another development that favors electric scooters is the advancement in the field of connected transport. They are also helping to enhance user experience, increase efficiency, and promote wider adoption.
Report Segmentation
The market is primarily segmented based on product, type, and region.
| By Product | By Type | By Region |
|
|
|
Source: Polaris Market Research Analysis
To Understand the Scope of this Report: Request Customization
By Product Analysis
Normal Scooters Segment Held the Largest Share in 2025
The normal scooter segment held the largest share. Growing consumer preference for vehicles that provide comfortable rides with gearless driving systems and operate at a minimal cost has propelled the sales of standard scooters. These scooters offer high mileage and sturdy bodies, enhancing maneuverability and contributing to the significant share in the segment.
The electric scooters segment is projected to grow at the fastest rate. Growing awareness regarding greenhouse gases, carbon emissions, & pollutants, coupled with a surge in demand for fuel-efficient 2-wheelers, is expected to drive the expansion of the segment. Additionally, governments globally are implementing new policies & regulations to boost the adoption of electric scooters, offering various incentives and benefits to consumers. The surge in the use of electric scooters for rental-sharing services has further contributed to the growth prospects.
By Type Analysis
Conventional Scooter Segment Registered the Largest Market Share in 2025
Conventional scooters segment accounted for the largest share. Traditional electric scooters are known for their lightweight design, durability, and lower initial and maintenance costs compared to their counterparts, making them widely embraced by consumers. Additionally, manufacturers in the traditional electric scooter segment prioritize the development of technologically advanced models at a competitive price, contributing to the high share within the segment.
The battery-swappable scooter segment will grow rapidly. This growth is driven by the automotive industry's growing emphasis on developing battery-swapping technology, enabling scooter owners to exchange depleted batteries with fully charged ones. Manufacturers of battery-swappable electric scooters are introducing models without pre-installed batteries, providing consumers with the flexibility to choose batteries based on their budget and specific requirements.
Types of Scooters
| Scooter Type | Description | Most Suitable Application |
| Electric Scooters | Electrically driven scooters that produce minimal pollutants and run quietly | City commuting, short-distance transport |
| Petrol Scooters | Conventional scooters fueled by gasoline | Long-distance transportation, daily commuting |
| Kick Scooters | Manual scooters propelled by the user effort | Short-range transport, leisure activities |
| Mobility Scooters | Scooters intended for senior citizens and those with disabilities | Mobility aid for individuals |
Source: Polaris Market Research Analysis
Source: Polaris Market Research Analysis
Need Granular Data Across All Market Segments? Request Customization
Regional Insights
APAC Held the Largest Share of the Global Market in 2025
APAC dominated the market. This dominant position is linked to the rising disposable income among consumers in the region. Individuals prefer personal vehicles over public buses, seeking to save time during traffic congestion. Additionally, electric scooters present a cost-effective option compared to electric motorcycles and mopeds, both in terms of initial purchase prices and ongoing maintenance expenses. The battery-powered nature of electric vehicles offers consumers a reprieve from the impact of escalating oil prices in the region.
North America is projected to grow at a rapid pace. Growth is attributed to the changing preferences of consumers towards rental electric scooters compared to other two-wheelers in the market. This shift reflects a growing trend where consumers are increasingly opting for the convenience and flexibility offered by rental electric scooters as a sustainable and efficient mode of urban transportation. The availability and accessibility of rental electric scooters contribute significantly to their popularity among consumers in these regions, fostering the overall growth of the market.
The European market is witnessing a surge in technological advancements, with manufacturers introducing vehicles equipped with cutting-edge features. These advancements include enhanced security measures, alert systems, self-diagnosis capabilities, remote telemetry, GPS tracking, motor and power deactivation, and speed limitation features. By integrating these intelligent and secure features, electric scooters in the European market are becoming smarter and more reliable.
The growth in innovation within the European electric scooter sector is expected to play a pivotal role in driving consumer demand for these vehicles. The incorporation of advanced technologies not only enhances the overall user experience but also addresses concerns related to safety and security. As a result, consumers are likely to be more inclined toward adopting electric scooters, contributing to the increasing popularity and demand for technologically advanced electric vehicles in the European market.
Source: Polaris Market Research Analysis
Curious About Regional Market Performance? Request Customization
Key Market Players & Competitive Insights
The primary strategy employed by key players in the market continues to be organic growth. Electric scooter manufacturers are actively engaging in product launch initiatives, particularly in emerging markets. For instance, Bird introduced an e-scooter in Helsinki in April 2022. This scooter stands out with advanced safety features and is equipped with an IP68-rated waterproof battery.
Some of the major players operating in the global market include:
- Yadea Technology Group Co., Ltd.
- Ninebot Ltd
- NEUTRON HOLDINGS, INC.
- Bird Rides, Inc.
- Spin
- GOTRAX
- SEGWAY INC.
- Razor USA LLC.
- Uber Technologies Inc.
- OKAI Inc.
Recent Developments
-
March 2026: Yadea made an announcement regarding the inauguration of its Smart Manufacturing Plant in Tan Hung Industrial Park, Bac Ninh Province. As per Yadea, the plant will cover an area of over 232,200 sq. m. and will have an initial capacity of manufacturing one million units annually. (source: prnewswire.com)
January 2026: Segway launched a series of innovative personal mobility products at CES 2026. The highlighted products include Myon and Muxi e-bicycles, Xaber300 e-dirt bike, and improved intelligent kick scooters. Some of the key features of these solutions are automatic transmission for e-bikes, connectivity technology (Apple Find My), and radar technology. (source: yadea.com)
Scooters Market Report Scope
| Report Attributes | Details |
| Market size in 2025 | USD 26.62 billion |
| Market size in 2026 | USD 28.21 billion |
| Revenue forecast in 2034 | USD 45.32 billion |
| CAGR | 6.1% from 2026 – 2034 |
| Base year | 2025 |
| Historical data | 2021 – 2024 |
| Forecast period | 2026 – 2034 |
| Quantitative units | Revenue in USD billion and CAGR from 2026 to 2034 |
| Segments covered | By Power Source, By Product, By Application, By Region |
| Regional scope | North America, Europe, Asia Pacific, Latin America, Middle East & Africa |
| Customization | Report customization as per your requirements with respect to countries, region, and segmentation. |
Source: Polaris Market Research Analysis
Scooters Market FAQ's
The global scooters market size is expected to reach USD 45.32 billion by 2034
Yadea Technology, Ninebot, NEUTRON HOLDINGS, Bird Rides, Spin are the top market players in the market.
APAC region contribute notably towards the global Scooters Market.
The global scooters market is expected to grow at a CAGR of 6.1% during the forecast period.
Product, type, and region are the key segments in the Scooters Market.
Download Sample Report of Scooters Market
Please fill out the form to request a customized copy of the research report.
