
Sensitive Compartmented Information Facility Market Drivers and Trends, 2025-2034
REPORT DETAILS
Market Statistics
What is Sensitive Compartmented Information Facility Market Size?
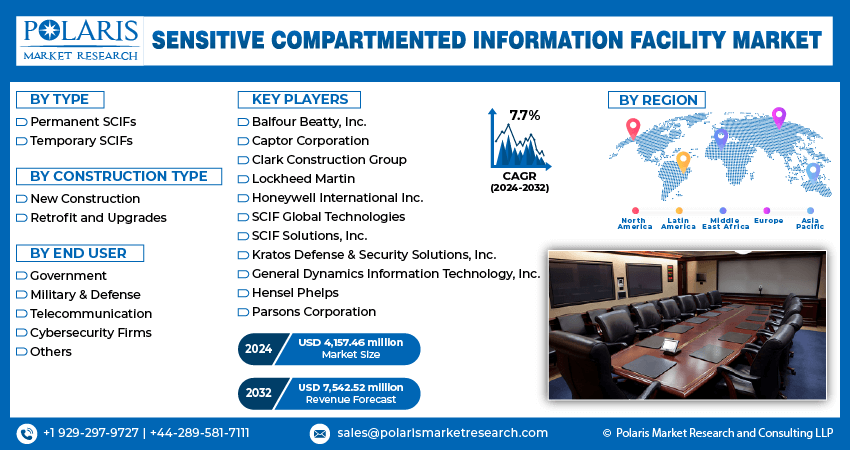
The global sensitive compartmented information facility market size was valued at USD 4.10 billion in 2024, growing at a CAGR of 7.6% from 2025–2034. Key factors driving demand is increase in the military & defense budget, and rising number of cyber-attacks.
Key Insights
- Permanent SCIFs segment dominated with the 71.79% share in 2024 due to strong demand from government and defense agencies
- Retrofit and upgrades segment is expected to witness a significant share over the forecast period due aging infrastructure and need for modernization
- North America sensitive compartmented information facility market dominated with 39.96% share in 2024 driven by high defense spending
- The Asia Pacific sensitive compartmented information facility market register growth rate of 8.7% during the forecast period due to rising defense and intelligence spending.
Industry Dynamics
- Increase in the military & defense budget is driving the growth.
- Rising number of cyber-attacks is fueling the growth.
- Integration of advance technology and software is boosting the growth.
- High cost and complexity of construction and accreditation is limiting the adoption in the short-term projects.
Market Statistics
- 2024 Market Size: USD 4.10 Billion
- 2034 Projected Market Size: USD 8.51 Billion
- CAGR (2025-2034): 7.6%
- North America: Largest Market Share
AI Impact on the Industry
- Improves security monitoring by automatically detect unauthorized access, anomalies, or unusual behavior within SCIFs.
- Improves threat analysis by analyzing patterns in cyber and physical security data.
- Manage secure access using facial recognition, biometrics, and behavioral analytics.
A sensitive compartmented information facility is a secure, enclosed area where the government and its contractors can handle sensitive compartmented information. It is meticulously designed to prevent unauthorized access and eavesdropping, incorporating stringent physical, acoustic, and electromagnetic security measures. These facilities are essential for protecting the nation's most sensitive intelligence and classified communications.
The geopolitical tension is rising in the nations. This has fueled the need to protect the sensitive information of the country from cyber breaches. Consequently, the demand for the sensitive compartmented information facilities is rising as governments are prioritizing the protection of their most sensitive intelligence. The SCIF includes sound-dampening walls, TEMPEST-shielded infrastructure which block electromagnetic signals and prevent unauthorized entry, visual surveillance, and electronic eavesdropping. Moreover, the network within a SCIF is heavily firewalled which completely isolates from the public internet, which help protect sensitive information from potential breach, thereby driving the industry growth.
Source: Polaris Market Research Analysis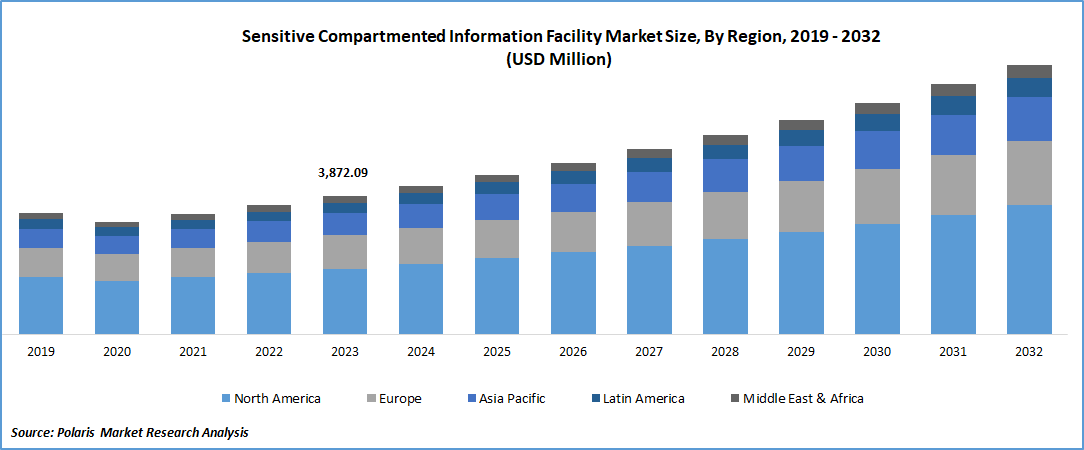
Want a Deeper Look at Key Market Players? Download Sample Report
Military forces of different nation globally are shifting from permanent, brick-and-mortar facilities to mobile and modular facilities. This has increased the demand for the mobile sensitive compartmented information facility which are build in containers and are able to quickly transported by automotive, ship, or air. It allows warfighters to have a top-secret command center anywhere in the world within days which supports missions in remote, austere, or rapidly changing combat zones. This ability is improving the appeal of the modular SCIF in wide range of applications, thereby driving the growth of the industry.
Drivers & Opportunities
What are Factors Driving Industry Growth?
Increase in the Military & Defense Budget: The military and defense budget worldwide is rising. According to the United States Senate Committee on Armed Services, in 2024, US alone allocated USD 841.4 billion in defense budget. This increase in the budget fuels the demand for compartmented facility for sensitive information as larger budget allocates specific funds for building new secure facilities. Budget increases pay for advanced new programs such as hypersonic weapons, artificial intelligence, and satellite systems which is handled in a SCIF. Moreover, increase in the defense budget is boosting the modernization of old infrastructure, which in turn is driving the demand for the modern, modular SCIFs, thereby fueling the growth.
Rising Number of Cyber Attacks: The number of state-sponsored cyber attack is rising worldwide. The sophisticated hackers and foreign spies use side-channel attacks by intercepting its radio signals, and listening through vibrations on a window. This rising number and increase in sophistication are fueling the demand for the secure facilities. A sensitive compartmented information facilities are specifically built to defend against these physical espionage methods. It acts as a secure, shielded Faraday cage that blocks all electromagnetic signals from escaping or entering, consequently fueling the industry growth.
The below table shows the number of data breaches from 2021 to 2023, escalating an urgent need for the secure facilities, in government and defense sectors.
Data Breach Incidents 2021–2023
| 2021–2023 | Number of Data Breaches | Year-over-Year Change (%) |
| 2021 | 1860 | - |
| 2022 | 1801 | -3.2% |
| 2023 | 3205 | 78.0% |
Source: Polaris Market Research Analysis
Source: Polaris Market Research Analysis
Get Full Segment-Level Forecasts & Insights: Download Sample Report
Segmental Insights
Why Permanent SCIFs Dominated in 2024?
Permanent SCIFs segment dominated with the 71.79% share in 2024 due to strong demand from government and defense agencies. These agencies handle operations that lasts for years, due to which the demand for permanent secure facilities is rising. Department of Defense, intelligence agencies, and federal contractors requires long-term, fixed-location facilities as it is engineered directly into a building’s architecture which offers stronger physical, acoustic, and electromagnetic protection. Moreover, these secure facilities are easier to certify and maintain accreditation under ICD 705 and other intelligence community standards, which further fuels the demand, thereby fueling the segment growth.
Which Segment by Construction Type is Expected to Witness a Significant Share?
Retrofit and upgrades segment is expected to witness a significant share over the forecast period due aging infrastructure and need for modernization. Many existing SCIFs were built 10–20+ years ago and no longer meet current security, technology, or design standards such as ICD 705 and TEMPEST requirements. This ageing infrastructure is driving the demand for the retrofits and upgrades as agencies and contractors are focusing on retrofitting older SCIFs with modern shielding, secure cabling, and upgraded physical barriers rather than building entirely new facilities. Moreover, security compliance and regulations are rapidly evolving due to which the demand for retrofitting and upgrades is further increasing to match current regulations landscape, consequently boosting the segment growth.
Source: Polaris Market Research Analysis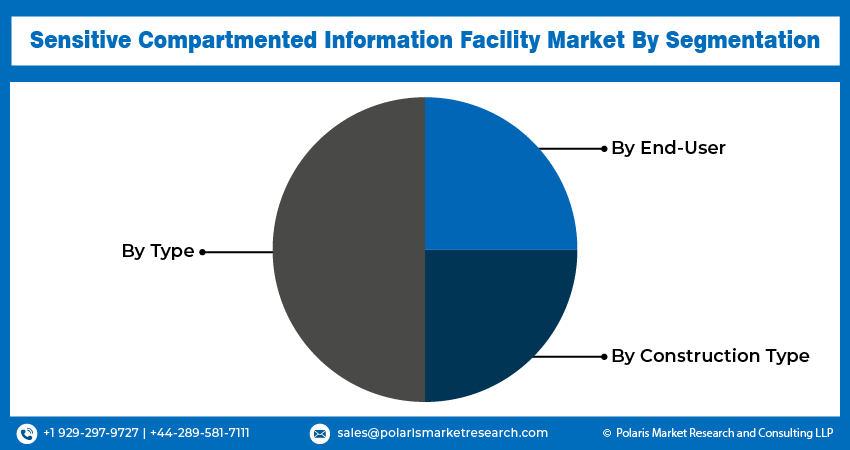
Need Granular Data Across All Market Segments? Request Customization
Regional Analysis
What are Regional Statistics of Industry?
North America sensitive compartmented information facility market dominated with 39.96% share in 2024 driven by high defense spending. Major countries in the region such as U.S. and Canada are spending major share of total budget on defense. As a result, the demand for secure facilities is rising. The region has one of the most stringent standards for secure facility such as ICD 705, JAFAN 6/9, and NISPOM. These stringent standard fuels the demand for the retrofits and upgrades to stay compliant with the evolving regulations. Moreover, rising number of cyber espionages, data breaches, and geopolitical tensions is further fueling the demand for the secure facilities, thereby driving the growth in the region.
The Asia Pacific sensitive compartmented information facility market register growth rate of 8.7% during the forecast period due to rising defense and intelligence spending. Major countries in the region such as China, Japan, South Korea, and India are increasing their spending in military sector, which is fueling the demand for the secure facilities. Moreover, the region is experiencing a surge in cyber threats and espionage, which is prompting defense and intelligence agencies to improve information security, further driving the demand, thereby driving the growth in the region.
Source: Polaris Market Research Analysis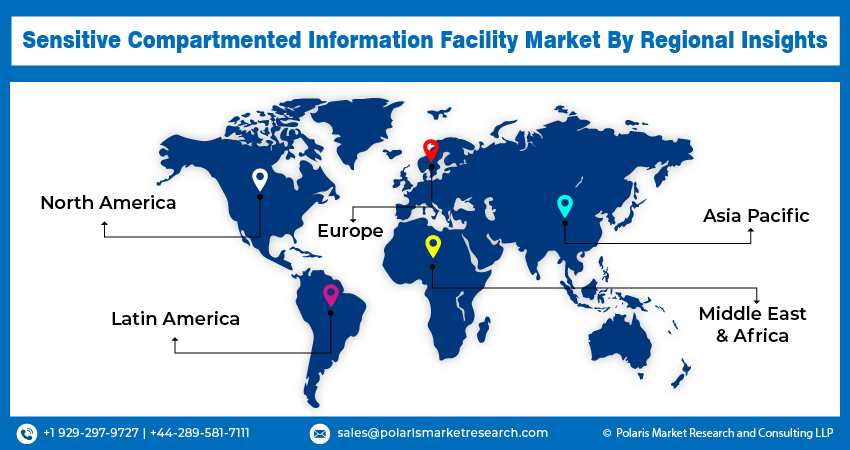
Curious About Regional Market Performance? Request Customization
Key Players & Competitive Analysis
The market is competitive and is dominated by established defense and construction players. Players such as Balfour Beatty, Clark, and Hensel Phelps lead in secure construction, while defense companies such as Lockheed Martin and General Dynamics IT are integrating advanced technical systems. Specialists such as Parsons and Kratos offer niche expertise in electronic shielding and accreditation. The landscape is defined by stringent government standards, high barriers to entry, and a focus on integrated physical and cybersecurity solutions, with firms competing on trust, compliance, and technological innovation.
Key Players
- Balfour Beatty, Inc.
- Captor Corporation
- Clark Construction Group
- General Dynamics Information Technology, Inc.
- Hensel Phelps
- Honeywell International Inc.
- Kratos Defense & Security Solutions, Inc.
- Lockheed Martin
- Parsons Corporation
- SCIF Global Technologies
Key Players Sales Area, Product Type
| Company Name | Sales Area | Product Type |
| Balfour Beatty, Inc. | United Kingdom and International |
|
| Captor Corporation | United States and International |
|
| Clark Construction Group | United States and International |
|
| Lockheed Martin | United States and International |
|
| Honeywell International Inc. | United States and International |
|
| SCIF Global Technologies | United States and International |
|
| Kratos Defense & Security Solutions, Inc. | United States and International |
|
| General Dynamics Information Technology, Inc. | United States and International |
|
| Hensel Phelps | United States and International |
|
| Parsons Corporation | United States and International |
|
Source: Polaris Market Research Analysis
Industry Developments
May 2025, CenCore secured a USD 19 million contract to build mobile SCIFs for the US Marine Corps' Project 7/11. The company delivered these patented, US-made units to enhance secure command and communications at the tactical edge.
June 2022, SG Blocks’ SG Echo unit manufactured a modular SCIF for a U.S. military client. The USD 767,682 project progressed to the production phase, utilizing the company's 70,000-square-foot fabrication facility.
Sensitive Compartmented Information Facility Market Segmentation
By Type Outlook (Revenue, USD Billion, 2020–2034)
- Permanent SCIFs
- Temporary SCIFs
By Construction Type Outlook (Revenue, USD Billion, 2020–2034)
- New Construction
- Retrofit and Upgrades
By Application Outlook (Revenue, USD Billion, 2020–2034)
- Government
- Military & Defense
- Telecommunication
- Cybersecurity Firms
- Others
By Regional Outlook (Revenue, USD Billion, 2020–2034)
- North America
- US
- Canada
- Europe
- Germany
- France
- UK
- Italy
- Spain
- Netherlands
- Russia
- Rest of Europe
- Asia Pacific
- China
- Japan
- India
- Malaysia
- South Korea
- Indonesia
- Australia
- Vietnam
- Rest of Asia Pacific
- Middle East & Africa
- Saudi Arabia
- UAE
- Israel
- South Africa
- Rest of Middle East & Africa
- Latin America
- Mexico
- Brazil
- Argentina
- Rest of Latin America
Report Scope
| Report Attributes | Details |
| Market Size in 2024 | USD 4.10 Billion |
| Market Size in 2025 | USD 4.40 Billion |
| Revenue Forecast by 2034 | USD 8.51 Billion |
| CAGR | 7.6% from 2025 to 2034 |
| Base Year | 2024 |
| Historical Data | 2020–2023 |
| Forecast Period | 2025–2034 |
| Quantitative Units | Revenue in USD Billion and CAGR from 2025 to 2034 |
| Report Coverage | Revenue Forecast, Competitive Landscape, Growth Factors, and Industry Trends |
| Segments Covered |
|
| Regional Scope |
|
| Competitive Landscape |
|
| Report Format |
|
| Customization | Report customization as per your requirements with respect to countries, regions, and segmentation. |
Source: Polaris Market Research Analysis
Sensitive Compartmented Information Facility Market FAQ's
The global market size was valued at USD 4.10 billion in 2024 and is projected to grow to USD 8.51 billion by 2034.
The global market is projected to register a CAGR of 7.6% during the forecast period.
North America dominated the market in 2024
A few of the key players in the market are Balfour Beatty, Inc., Captor Corporation, Clark Construction Group, General Dynamics Information Technology, Inc., Hensel Phelps, Honeywell International Inc., Kratos Defense & Security Solutions, Inc., Lockheed Martin, Parsons Corporation, and SCIF Global Technologies.
The permanent SIFC segment dominated the market revenue share in 2024.
The retrofit and upgrade segment is projected to witness the fastest growth during the forecast period.
Download Sample Report of Sensitive Compartmented Information Facility Market
Please fill out the form to request a customized copy of the research report.
