
Shea Butter Market Size, Share, Emerging Trends, 2024-2032
REPORT DETAILS
The global shea butter market was valued at USD 2.09 billion in 2023 and is expected to grow at a CAGR of 6.70% during the forecast period.
Market is expected to witness growth in the coming years, driven by the rising demand for confectionery and baked goods, along with the need for cocoa butter substitutes. Shea butter serves as a crucial raw ingredient in various baked goods, including puff pastry, biscuits, & chocolates.
Source: Polaris Market Research Analysis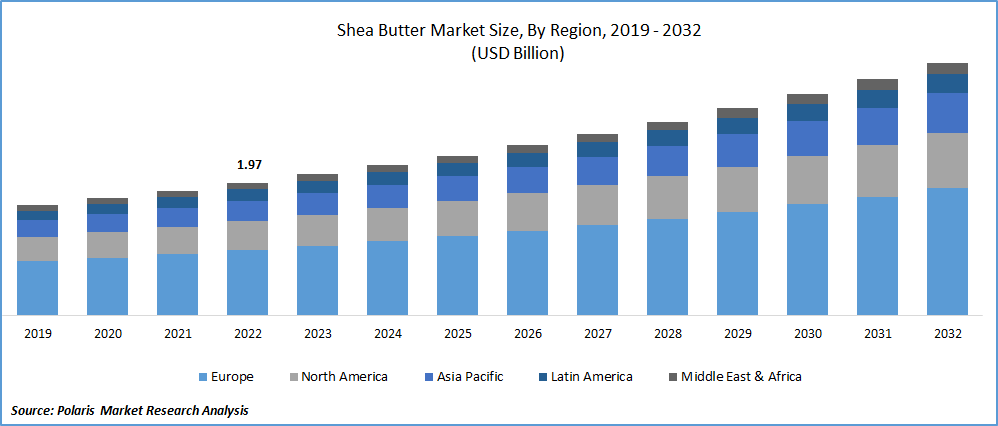
To Understand More About this Research: Download Sample Report
For instance, in December 2020, Bunge Loders Croklaan introduced a shea-based butter to enhance its chocolate confectionery offerings, aligning with consumer preferences for sustainable food options. These developments and increasing applications of shea butter in the food industry are anticipated to propel the market's expansion across the forecast period.
Market is expanding due to number of product launches in the cosmetics & personal care segment. Notably, Byrdie, in February 2022, introduced a new skincare line called “Karite”. This brand offers a variety of essentials such as body cream, hand cream, and lip balm, all formulated with pure shea butter and palm oil sourced from their West African homeland. The Karité products boast antioxidants and anti-inflammatory properties, catering to the growing demand for natural and effective skincare solutions. These offerings are readily available in various retail and beauty stores across the United States and Canada, contributing to the market's overall expansion.
The market faced adverse effects from the COVID-19 outbreak as it led to disruptions in the supply chain, causing a shortage of raw materials for shea butter manufacturing units due to stringent lockdown measures. The closure of businesses and shops also resulted in reduced sales of shea butter-based products. According to a report published by the National Center for Biotechnology Information (NCBI) in November 2021, the usage of shea butter in soap products witnessed a decline of 25%. Additionally, the global economic recession prompted consumers to adopt cautious spending habits, further impacting the market.
Source: Polaris Market Research Analysis
Get Full Segment-Level Forecasts & Insights: Download Sample Report
Industry Dynamics
Growth Drivers
Rising Demand for Natural and Sustainable Skincare
Market is set to experience a surge in revenue in the coming years, driven by the increased awareness of the therapeutic benefits of shea butter for skin, including its anti-aging properties, exceptional moisturization capabilities, and healing effects. Moreover, the rising preference for natural ingredient-based cosmetic products, especially among women and young individuals, is anticipated to drive the market's growth.
According to an article published by National Programs in March 2022, approximately 85% of consumers worldwide prefer skin care products that contain natural ingredients like shea butter. This consumer trend towards natural and beneficial skincare solutions is expected to further support the expansion of the market in the foreseeable future.
Report Segmentation
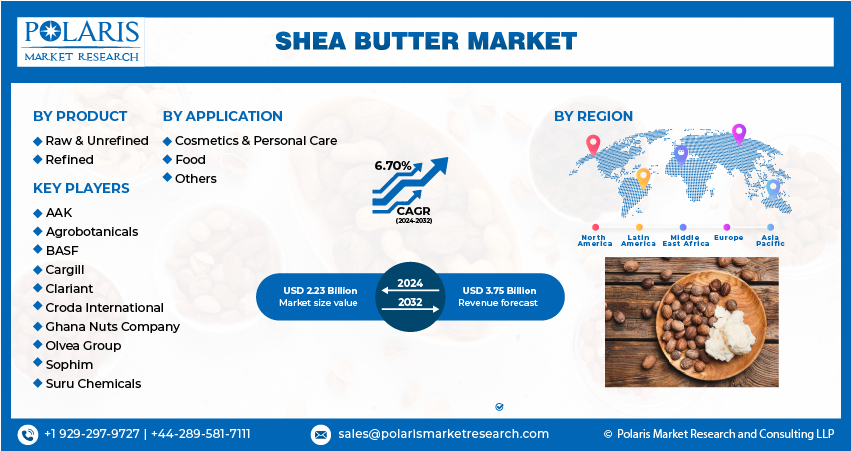
The market is primarily segmented based on product, application, and region.
| By Product | By Application | By Region |
|
|
|
Source: Polaris Market Research Analysis
To Understand the Scope of this Report: Request Customization
By Product Analysis
Raw & Refined Shea Butter Segment Accounted for the Largest Share in the Market
Raw & refine shea butter accounted for largest market share. The growing interest among consumers in less processed oils is driving the popularity of raw and unrefined shea butter. Its numerous benefits, such as boosting skin moisture, promoting healing of cuts and scrapes, and aiding in combating breakouts, have contributed to the increasing preference for this type of shea butter in skincare and personal care products.
Refined segment is likely to register highest growth rate. This trend is attributed to the rising consumer preference for refined shea butter due to its longer shelf life. Additionally, the refining process removes the scent and color of the product, making it an ideal choice for manufacturers developing anti-sensitive skincare products. The increasing adoption of refined shea butter in the skincare industry is anticipated to expand its scope and market demand.
By Application Analysis
Food Segment Expected to Gain Significant Traction Over the Forecast Period
Food segment is projected to hold significant market share. This significant growth is driven by the increasing premiumization of food and beverages, leading to a higher utilization of shea butter in this segment. Moreover, the growing demand in the chocolate market is expected to contribute to the rise in shea butter consumption, as it is used to enhance the texture, consistency, and other properties of chocolate products.
According to an article published by Tastewise, in October 2021, shea butter's total consumption demonstrated an annual growth rate of 8.63%. This data further underscores the upward trend in the utilization of shea butter in the food industry, supporting its projected rapid growth over the forecast period.
Cosmetic & personal care segment witnessed steady growth. Rising consumer interest of the product as a preferred ingredient in various skincare and personal care products, including creams, lotions, cosmetics, & toiletries. The increasing health and beauty awareness among consumers, coupled with the growing importance of the product developers, has led to a steady rise in demand for organic and natural cosmetics.
According to an article published by Wonderflow in January 2022, approximately 24% of U.S. adults are customers of natural skincare products, highlighting the growing demand for such offerings. This trend is creating opportunities for key players in the industry to innovate and develop new products that cater to the preferences of health-conscious and environmentally-conscious consumers. As a result, the cosmetics & personal care segment is expected to continue its growth trajectory over the forecast period.
Source: Polaris Market Research Analysis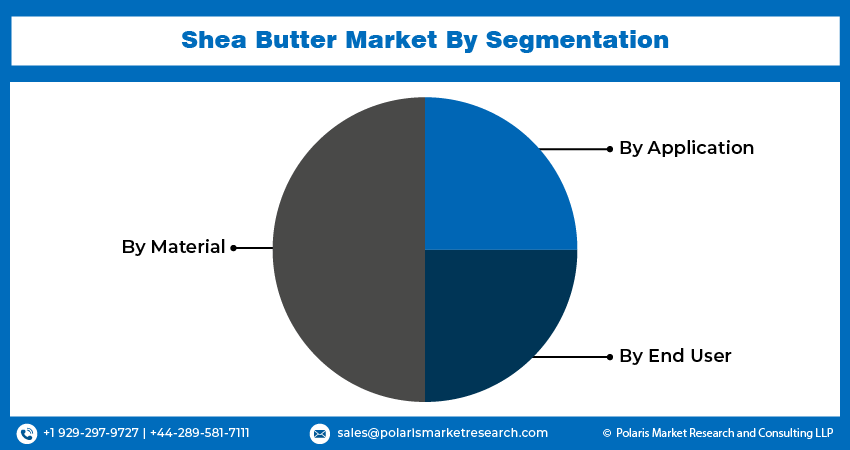
Need Granular Data Across All Market Segments? Request Customization
Regional insights
Europe Region Dominated the Global Market in 2022
Europe dominated the global market. The region's dominant position can be attributed to the extensive use of shea butter in various industries, particularly cosmetics and pharmaceuticals. Shea butter is a key ingredient in the manufacturing of products like body lotions, moisturizers, and chocolates, which are in high demand in the European market. According to an article published by the Centre for the Promotion of Imports (CBI) in March 2022, approximately 25% of shea butter consumption worldwide is accounted for by Europe, with the ingredient being utilized in a diverse range of products. This high consumption is driven by the presence of many cosmetics and pharmaceutical industries in the region that incorporate shea butter in their formulations.
Moreover, the growth in the region is expected to continue due to the abundant supply of raw materials from Sub-Saharan countries. These countries serve as major producers of shea nuts, the primary source of shea butter, and their proximity to Europe facilitates a steady and reliable supply chain.
APAC is likely to emerge as fastest growing region. This growth is largely driven by the region's vast population, with India and China being the major contributors. According to United Nations statistics from December 2021, more than half of the world's population resides in the Asia Pacific region. This substantial population provides a substantial consumer base for manufacturers, enabling them to better understand the market size and preferences, and develop new products accordingly.
For instance, in January 2019, Shilla DF responded to the demand of consumers in China by introducing new L'Occitane hand cream. It demonstrates how companies are leveraging market insights to cater its specific needs & preferences of consumers, contributing to the overall growth. The region's large and diverse consumer base offers immense potential for manufacturers to capitalize on market opportunities and drive the growth.
Source: Polaris Market Research Analysis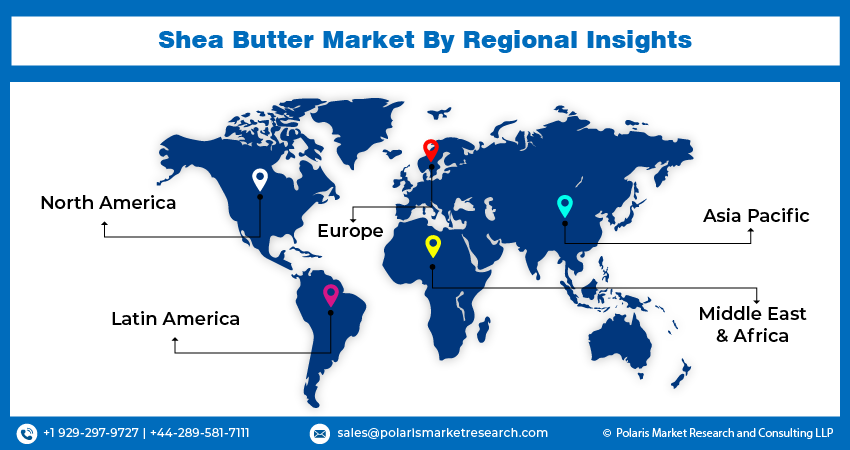
Curious About Regional Market Performance? Request Customization
Market Key Players & Competitive Insight
In the highly competitive shea butter market, key players are increasingly focusing on product innovation and sustainability to gain a competitive edge. Companies are investing in research and development to introduce new shea butter-based skincare and cosmetic products with enhanced formulations to cater to evolving consumer preferences for natural and organic products. The competition is expected to intensify as more players enter the market, emphasizing the need for differentiation, quality, and ethical sourcing to maintain and expand market share.
Key players in the global market include:
- AAK
- Agrobotanicals
- BASF
- Cargill
- Clariant
- Croda International
- Ghana Nuts Company
- Olvea Group
- Sophim
- Suru Chemicals
Recent Developments
- In September 2021, in an expansion move, Shea Radiance introduced a lineup of six new body care products, making them available in 520 Whole Foods Stores.
- In May 2021, Crafters Choice recently unveiled wide range of personal care products, including body lotion & soap formulations, all crafted using pure shea butter as a key ingredient.
- In March 2020, Karite Shea Butter has introduced its latest offering, the “Creme Corps Body Cream”. This product harnesses the benefits of raw & un-refined shea butter, ensuring it is gentle and safe for the skin. Such strategic product launches are anticipated to bolster the growth trajectory of the market.
Shea Butter Market Report Scope
| Report Attributes | Details |
| Market size value in 2024 | USD 2.23 billion |
| Revenue forecast in 2032 | USD 3.75 billion |
| CAGR | 6.70% from 2024 – 2032 |
| Base year | 2023 |
| Historical data | 2019 – 2022 |
| Forecast period | 2024 – 2032 |
| Quantitative units | Revenue in USD billion and CAGR from 2024 to 2032 |
| Segments covered | By Product, By Application, By Region |
| Regional scope | North America, Europe, Asia Pacific, Latin America, Middle East & Africa |
| Customization | Report customization as per your requirements with respect to countries, region, and segmentation. |
Source: Polaris Market Research Analysis
Shea Butter Market FAQ's
key companies in shea butter market are BASF, Olvea Group, Sophim, Cargill, Suru Chemicals
The global shea butter market is expected to grow at a CAGR of 6.7% during the forecast period.
The shea butter market report covering key segments are product, application, and region.
key driving factors in industrial shea butter market are rising demand for natural and sustainable skincare.
The global shea butter market size is expected to reach USD 3.75 billion by 2032.
Download Sample Report of Shea Butter Market Size, Share, Emerging Trends, 2024-2032
Please fill out the form to request a customized copy of the research report.
