
Reports

Smart Home Energy Monitoring Devices Market Leading Companies, Drivers, 2025-2034
REPORT DETAILS
REPORT DETAILS
ABOUT THIS REPORT
Market Statistics
Market Overview
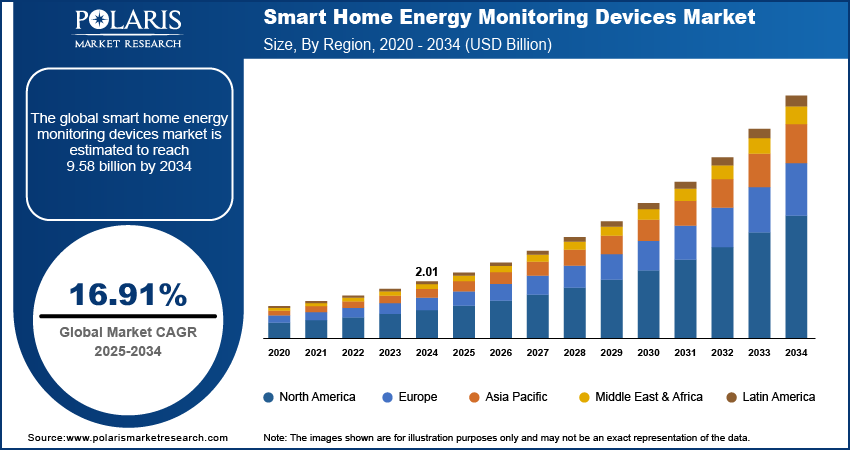
The smart home energy monitoring devices market was valued at USD 2.01 billion in 2024 growing at a CAGR of 16.91% from 2025-2034. Rising global energy consumption and growing awareness of environmental sustainability promoting smart home energy monitoring devices.
Key Insights
- Hardware segment dominated in 2024 due to high adoption of smart meters.
- Software segment is expected to grow fastest, driven by AI and cloud analytics.
- North America led the market in 2024 with strong smart home adoption.
- The U.S. dominated North America with widespread connected energy system installation.
- Asia Pacific is projected to grow fastest driven by rising urbanization and electricity demand.
- China led in Asia Pacific due to large-scale manufacturing and government support for smart logistics.
Industry Dynamics
- Increasing global energy consumption pushing the adoption of smart home energy monitoring devices.
- Growing awareness of environmental sustainability and carbon footprint reduction is driving consumer interest in energy monitoring solutions.
- High initial costs and installation complexity continue to restrain market growth.
- Growing smart grid infrastructure all over the world provides new market opportunities.
Market Statistics
- 2024 Market Size: USD 2.01 Billion
- 2034 Projected Market Size: USD 9.58 Billion
- CAGR (2025-2034): 16.91%
- North America: Largest Market Share
Smart home energy monitoring equipment allows consumers to monitor, control, and optimize the consumption of electricity with the use of IoT sensors, IoT connectivity, and data analytics. These solutions combine mobile applications, smart meters, and cloud platforms for enhancing energy efficiency and lowering electricity bills.
Increasing electricity prices and increasing consciousness of environmental sustainability are driving demand for intelligent energy monitoring devices. Customers are embracing AI-powered and IoT-enabled systems to increase energy efficiency, increase cost savings, and minimize carbon emissions. Smart home solution leaders introduced AI-driven apps that provide real-time energy feedback, automated load control, and predictive energy use projections.
Homeowners in developed countries are investing in connected energy solutions to reduce utility bills and support renewable energy integration. In March 2025, SAJ has launched eleX Home, a fully automated smart energy system that optimizes home energy use using AI and integrated components. Major suppliers are launching modular, easy-to-use, and cloud-capable monitoring products to make real-time monitoring more efficient, compatible with smart home systems and overall energy management effectiveness.
Drivers & Opportunity
Increasing global energy consumption and demand for efficiency: Growing worldwide energy need is pressurizing homes to have better management of electricity consumption. International Energy Agency unveiled that worldwide energy need increasing 2.2% in 2024, higher than the 1.3% average for the period 2023. Smart home energy monitoring products enable users to monitor instantaneous use, locate power-drinking appliances, and save energy. This saves them on electricity bills and gives them improved energy management, hence the growing need for such devices in energy-efficient homes.
Growing awareness of environmental sustainability and carbon footprint reduction: Customers are increasingly aware of their carbon footprint and the importance of minimizing carbon emissions. The United Nations (UN) stated that 107 countries covering 82% of global emissions had adopted net-zero pledges by June 2024, while over 9,000 companies, 1,000 cities, and 600 financial institutions joined the Race to Zero to cut emissions by half by 2030. Smart home energy monitoring solutions provide insights into energy consumption patterns and enable sustainable energy practices, such as shifting usage to off-peak hours or integrating renewable energy sources. This increasing emphasis on sustainability is supporting broader take-up of energy monitoring devices in homes all over the world.
Segmental Insights
Component Analysis
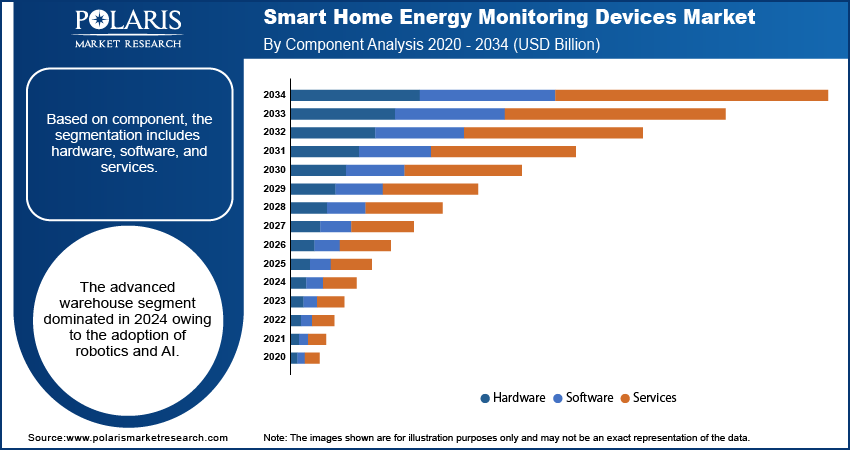
In terms of component, the segmentation consists of hardware, software and services. The hardware segment dominated the market in 2024, driven by high demand for smart sensors and energy meters in homes. Moreover, increasing consumer preference for reliable and durable devices is supporting revenue growth through forecast period.
The software segment is projected to grow at the fastest CAGR during the forecast period, due to rising adoption of AI-enabled apps and energy management platforms. In addition, cloud-based analytics and real-time monitoring solutions are fueling faster adoption globally.
Technology Analysis
Based on technology, the segmentation includes Wi-Fi, Zigbee, Z-wave, Bluetooth, and others. Wi-Fi solutions dominated the market in 2024, fueled by extensive home network support and integration convenience with already installed smart devices. In addition, growing consumer interest in remote control and monitoring is driving hardware and software adoption.
The Zigbee segment is expected to register the highest growth during the forecast period, driven by low-power consumption and strong interoperability with multiple smart home systems. In addition, rising integration in energy-efficient solutions enhances its market potential.
Product Type Analysis
Based on product type, the segmentation includes smart thermostats, smart light bulbs, energy monitoring devices, smart appliances, and other products. Energy monitors led the market in 2024, driven by rising electricity prices and a requirement for granular energy consumption information. Additionally, increasing use in smart homes in residential areas is maximizing energy optimization and cost savings. For example, in May 2024, Siemens collaborated with Emporia to introduce the Inhab Energy Monitor, allowing homeowners to monitor real-time energy consumption, solar production, and EV charging using an app.
The smart thermostats segment is expected to expand at the highest CAGR until 2034, propelled by customer demand for climate control and energy efficiency on automation. Furthermore, integration with AI and smartphones is driving fast market adoption in all regions.
Regional Analysis
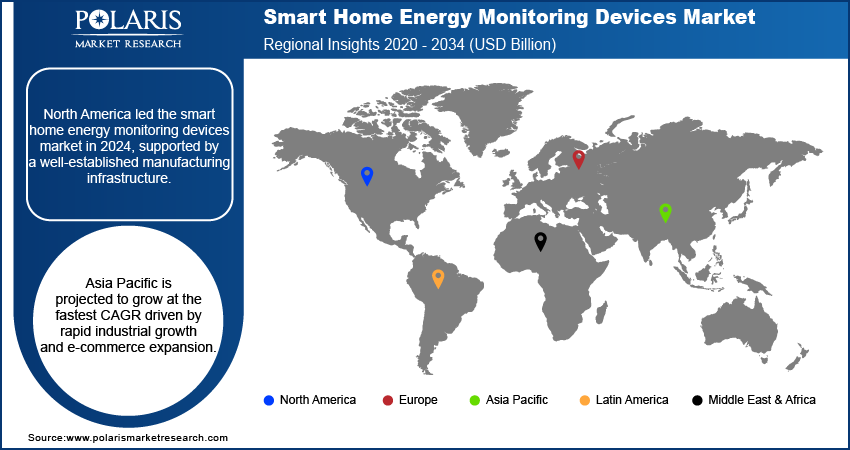
North America led the market in 2024, fueled by high electricity prices and robust uptake of smart home technologies. Additionally, rising government incentives for energy efficiency programs fuel market growth. As per U.S. Department of Energy (DoE), the U.S. energy sector workforce grew 3% to 8.36 million in 2023, with over 2 million employed in energy efficiency roles. In addition, rising consumer awareness of sustainability further boosts adoption.
The U.S. Smart Home Energy Monitoring Devices Market Insights
The U.S. led the smart home energy monitoring devices market due to widespread smart home penetration and supportive federal energy efficiency regulations. Moreover, growing investments in AI-enabled energy management solutions enhance adoption. In addition, consumer preference for connected home devices fuels market growth.
Europe Smart Home Energy Monitoring Devices Market Insights
Europe holds the significant market share in the smart home energy monitoring devices industry driven by stringent energy-saving regulations and rising adoption of renewable energy systems. Moreover, increasing consumer focus on reducing carbon footprints supports the adoption of smart energy monitoring devices.
Asia Pacific Smart Home Energy Monitoring Devices Market Insights
Asia Pacific is the fastest growing market fueled by rapid urbanization and increasing electricity demand in residential sectors. According to UN-Habitat, urbanization is a major trend in Asia-Pacific, with 54% of the world’s urban population, over 2.2 billion people, living in the region, and this is expected to grow by 50% to add 1.2 billion more by 2050. Further, government policies encouraging energy-efficient technologies fuel market uptake. Additionally, growing investments in smart city projects further fuel growth.
China Smart Home Energy Monitoring Devices Market Insights
China led the Asia Pacific region with increasing urban household energy consumption and government incentives for smart energy solutions. Moreover, increasing adoption of IoT-enabled home devices encourages market expansion. In addition, technological advancements in monitoring systems enhance regional growth.
Key Players & Competitive Analysis Report
The smart home energy monitoring devices market is moderately competitive, as companies are enhancing offerings in IoT-enabled sensors, AI-powered energy management apps, and cloud-based analytics. Furthermore, investments in integration with smart homes, energy prediction and optimization, and collaboration with utility companies and device makers enhance adoption, scalability, and international market presence.
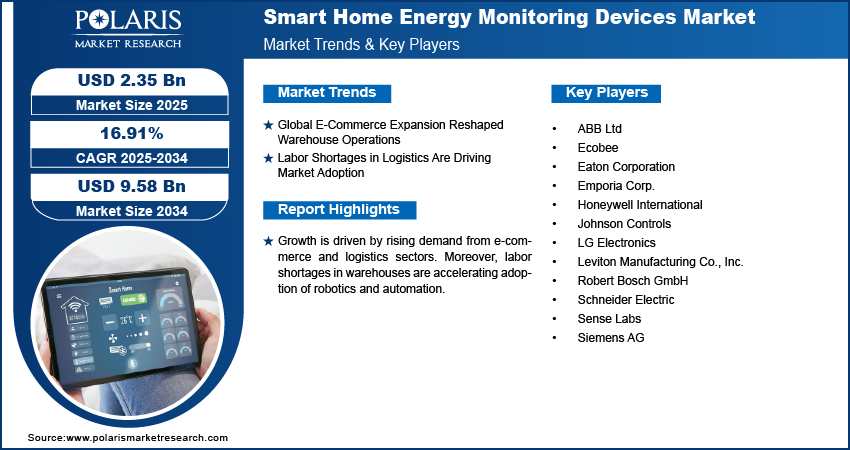
Major companies operating in the smart home energy monitoring devices market include Schneider Electric, Siemens AG, Honeywell International, ABB Ltd, Leviton Manufacturing Co., Inc., Eaton Corporation, Johnson Controls, Emporia Corp., Robert Bosch GmbH, LG Electronics, Ecobee, and Sense Labs.
Key Players
- ABB Ltd
- Ecobee
- Eaton Corporation
- Emporia Corp.
- Honeywell International
- Johnson Controls
- LG Electronics
- Leviton Manufacturing Co., Inc.
- Robert Bosch GmbH
- Schneider Electric
- Sense Labs
- Siemens AG
Industry Development
- August 2025, Siemens acquired a stake in Emporia Energy to enhance smart home energy monitoring. Building on the Inhab Energy Monitor, the partnership provides real-time insights into appliance, EV charger, and solar usage, helping homeowners optimize energy and costs while advancing residential energy management innovation.
- May 2025: ABB introduced Smart EMS, a home energy management system that maximizes energy usage and is compatible with many devices.
- January 2025, Resideo Technologies launched the Honeywell Home X2S smart thermostat at CES 2025. Matter-enabled and ENERGY STAR certified, priced at $79.99, it offers up to 22% heating and 17% cooling savings, with Alexa, Google Home, Apple Home, and Resideo app compatibility, plus easy installation and air quality features.
- September 2024: Schneider Electric launched an AI-based feature in the Wiser Home app that maximizes energy consumption by water heaters and EV chargers based on learning user behavior, weather forecasts, and tariff information to cut down energy bills and increase sustainability.
Smart Home Energy Monitoring Devices Market Segmentation
By Component (Revenue, USD Billion, 2020–2034)
- Hardware
- Software
- Services
By Technology (Revenue, USD Billion, 2020–2034)
- Wi-Fi
- Zigbee
- Z-wave
- Bluetooth
- Others
By Product Type (Revenue, USD Billion, 2020–2034)
- Smart Thermostats
- Smart Light Bulbs
- Energy Monitoring Devices
- Smart Appliances
- Other Products
By Region (Revenue, USD Billion, 2020–2034)
- North America
- The U.S.
- Canada
- Europe
- Germany
- France
- UK
- Italy
- Spain
- Netherland
- Russia
- Rest of Europe
- Asia Pacific
- China
- India
- Japan
- Malaysia
- South Korea
- Indonesia
- Australia
- Rest of Asia Pacific
- Latin America
- Mexico
- Brazil
- Argentina
- Rest of Latin America
- Latin America
- Saudi Arabia
- UAE
- South Africa
- Israel
- Rest of South Africa
Smart Home Energy Monitoring Devices Market Report Scope
| Report Attributes | Details |
| Market Size in 2024 | USD 2.01 Billion |
| Market Size in 2025 | USD 2.35 Billion |
| Revenue Forecast by 2034 | USD 9.58 Billion |
| CAGR | 16.91% from 2025 to 2034 |
| Base Year | 2024 |
| Historical Data | 2025-2034 |
| Forecast Period | 2025-2034 |
| Quantitative Units | Revenue in USD Billion and CAGR from 2025 to 2034 |
| Report Coverage | Revenue Forecast, Competitive Landscape, Growth Factors and Industry Trends |
| Segments Covered |
|
| Regional Scope |
|
| Competitive Landscape |
|
| Report Product Type |
|
| Customization | Report customization as per your requirements with respect to countries, regions and segmentation. |
FAQ's
The global market size was valued at USD 2.01 billion in 2024 and is projected to grow to USD 9.58 billion by 2034.
The global market is projected to register a CAGR of 16.91% during the forecast period.
North America dominated the smart home energy monitoring devices market in 2024 due to strong manufacturing infrastructure.
A few of the key players in the market are Schneider Electric, Siemens AG, Honeywell International, ABB Ltd, Leviton Manufacturing Co., Inc., Eaton Corporation, Johnson Controls, Emporia Corp., Robert Bosch GmbH, LG Electronics, Ecobee, and Sense Labs.
The advanced warehouse segment dominated in 2024 due to robotics and AI adoption.
The pharmaceutical segment is projected to grow fastest, driven by precise inventory tracking and automated handling of sensitive products.
Download Sample Report of Smart Home Energy Monitoring Devices Market
Please fill out the form to request a customized copy of the research report.
