

Report Outlook
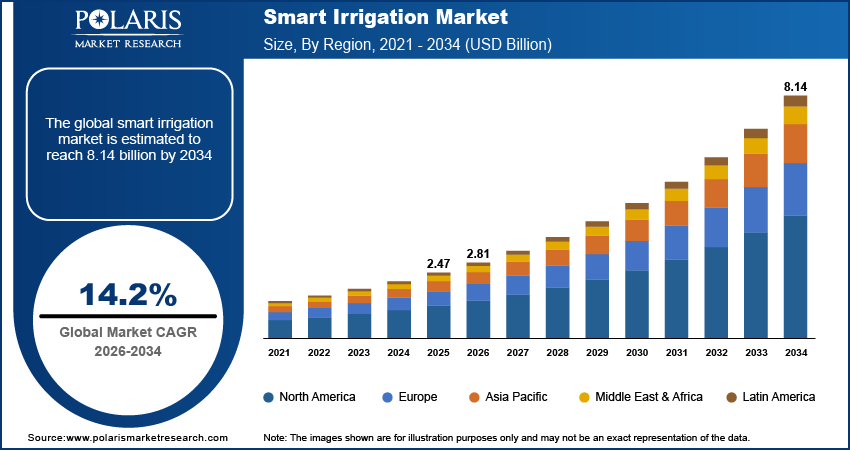
The global smart irrigation market size was valued at USD 2.47 billion in 2025. According to our smart irrigation market forecast, the market is projected to account for a CAGR of 14.2% between 2026 and 2034. The market is witnessing steady growth with more farmers, landscaping businesses, municipalities, and residents using smart irrigation systems to optimize their water management. Smart irrigation systems are proving helpful in automating watering schedules and land management. The rising trend of precision farming and the increasing adoption of connected irrigation controllers and sensors are creating an opportunity for smart irrigation systems. Additionally, the rise in sustainable trends and the need to save water are creating favorable conditions for market growth.
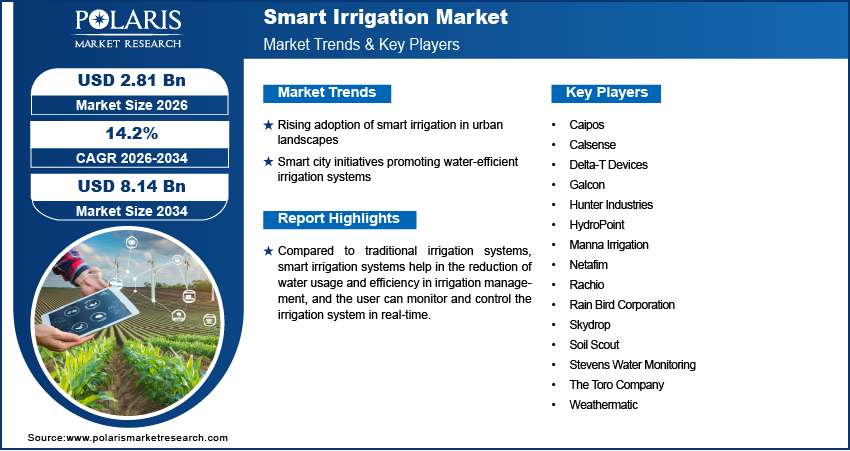
Smart irrigation systems integrate various technologies such as controllers, sensors, water flow meters, communications, and software. They help in the efficient management of water through the optimization of irrigation schedules based on various factors such as moisture in the soil, weather conditions, crop water requirements, and landscape water requirements. Compared to traditional irrigation systems, smart irrigation systems help in the reduction of water usage and efficiency in irrigation management, and the user can monitor and control the irrigation system in real-time.
Key Insights
- The sensor-based segment is projected to account for the highest growth rate. This is primarily due to the increased use of sensor-based automated systems to improve farm productivity.
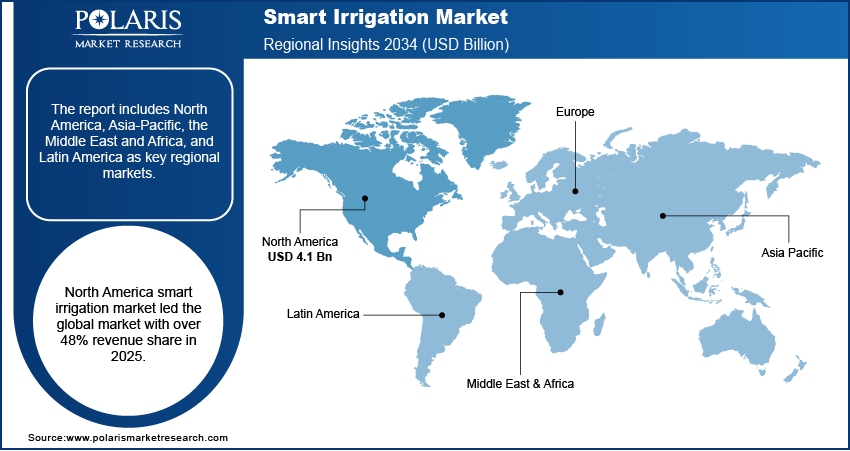
- North America led the smart irrigation market with over 48% revenue share in 2025. This is due to the widespread adoption of modern smart irrigation technology in the region.
- The controllers segment accounted for the largest market share in 2025. This is because controllers are the operational foundation of irrigation automation systems
- Asia Pacific is projected to witness the highest CAGR. The rising proliferation of IoT-based irrigation practices in emerging economies such as China and India is driving the regional market growth.
Industry Dynamics
- The rising usage of effective watering techniques for non-agricultural applications such as turf and golf courses is one of the major factors driving market growth.
- The market is benefiting from the need for efficient use of water and minimizing human resources in emerging economies.
- The shift towards smart cities is creating several opportunities for market expansion.
- Limited technical knowledge of farmers may limit market development.
Market Statistics
2025 Market Size: USD 2.47 billion
2034 Projected Market Size: USD 8.14 billion
CAGR (2026–2034): 14.2%
North America: Largest Market Share
AI Impact on Smart Irrigation Market
- AI can assist in determining when and how to irrigate crops based on weather and soil conditions, thereby reducing unnecessary water waste.
- Using AI, the crop can be provided with the right amount of irrigation at the right time, promoting healthy growth without stressing the crop from excess or insufficient water.
- AI-powered systems allow farmers to easily control and monitor their irrigation systems from their phones or computers.
- Using AI, farmers can reduce unnecessary water and energy waste, thereby lowering the irrigation system's operating expenses.
To Understand More About this Research:Request a Free Sample Report
The increased adoption of automated monitoring systems in agriculture and the declining costs of sensors and controllers are driving market growth. The automated irrigation monitoring system uses irrigation sensors, smart irrigation controllers, and automated equipment to monitor soil, weather, water, and fertility. Smart irrigation systems have become increasingly popular over the past few years, mainly due to the adoption of modern farming practices and their application in non-agricultural regions. Moreover, the integration of smart irrigation systems with mobile applications, cloud-based dashboards, and farm management software is enhancing the system’s ease of use for open fields, greenhouses, turf, and residential regions.
The global COVID-19 pandemic has had an impact on the smart irrigation market. The pandemic affected different sectors of the economy. In the agricultural sector, the short-term effect was felt in the supply chain for smart farming irrigation systems. Nevertheless, the period also emphasized the need for data-driven farming and remote irrigation monitoring. The increased awareness among farmers about the usage of technology in farming activities has fueled the usage of sensors such as soil moisture sensors, climate sensors, rain sensors, temperature sensors, and fertigation sensors, which created market opportunities during the pandemic period. Today, the market is influenced by long-term trends such as water scarcity and the need to improve labor productivity. The market is also affected by the shift towards sustainability and precision agriculture.
Other forms of integrated irrigation systems, such as controllers and water flow meters, are expected to increase in adoption in developing countries due to issues of labor shortages in managing these systems. However, in the post-COVID-19 era, access to remote controllers of irrigation systems and receiving data from the fields are key drivers of the growth of smart irrigation systems. The adoption of these systems is also expected to increase in emerging smart irrigation markets due to increased mobile network accessibility, high costs of inputs, and the need for efficient use of water and minimizing human resources in these countries.
Industry Dynamics
Growth Drivers
A major factor contributing to the growth of the smart irrigation market is the need for efficient irrigation systems in non-agricultural sectors such as residential, turf, landscaping, and golf course irrigation systems. In various parts of the world, the emergence of smart city initiatives has encouraged governments to promote smart city irrigation systems. In addition, the expansion of smart landscaping schemes and stringent water-saving rules is boosting the demand for water-saving irrigation systems in urban and semi-urban cities.
Smart cities focus significantly on the efficient management and treatment of water in urban and business settings. Due to urbanization and deforestation, smart irrigation systems are now employed to assist in the maintenance of a balanced and healthy urban ecosystem. Consequently, business establishments and cities are embracing weather-sensitive and sensor-integrated irrigation systems for efficient and effective maintenance of urban settings, thereby reducing runoff and overwatering.
Furthermore, the overwatering caused by inefficiencies in conventional irrigation systems leads to water waste. Therefore, the development of smart cities is expected to provide opportunities for new entrants in the market. The smart city technology is expected to increase the demand for smart irrigation controllers. A similar approach is seen in the agricultural industry with the rise of precision irrigation, which utilizes soil moisture, nutrient content, and remote monitoring technologies to optimize crop performance and reduce water and labor costs. This trend is creating opportunities not only for hardware vendors but also for software and service providers offering irrigation analytics platforms and optimization services.
Report Segmentation
By Component Insights
Based on component, the market is segmented into controllers, sensors, water flow meters, and others. The controllers segment led the market in 2025. Controllers are the operational foundation of irrigation automation systems. They facilitate accurate measurements, scheduling, and decision-making in watering systems. Software-connected controllers are becoming increasingly vital as users seek remote access, data insights, and coordination of their irrigation systems in different locations.
By System Type Insights
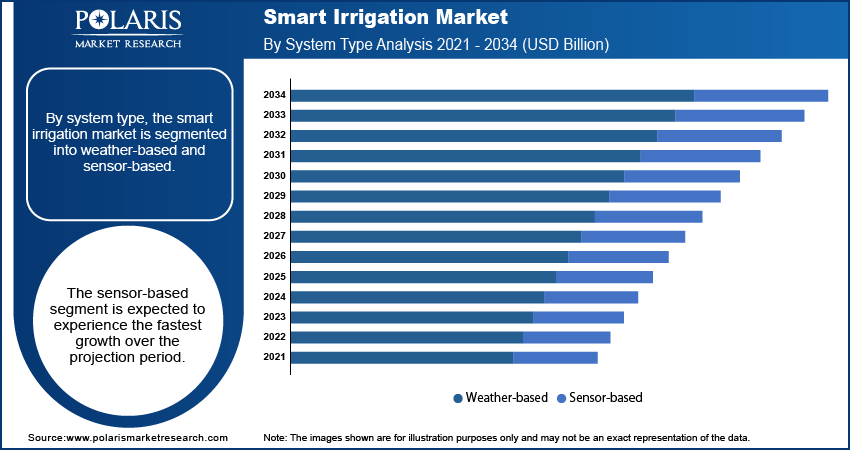
By system type, the smart irrigation market is segmented into weather-based and sensor-based. The sensor-based segment is expected to experience the fastest growth over the projection period. This segment is mainly driven by the increasing use of sensor-based automated systems in agricultural activities, which help improve farm productivity. Such systems can provide real-time information on humidity, rainfall, moisture, nutrient content, and temperature required. Sensor-based automated systems are more popular than weather-based systems because they rely on actual conditions rather than weather forecasts derived from weather station data. It helps farmers make more accurate irrigation decisions by providing real-time irrigation monitoring information.
In sensor-based systems, data is collected from field sensors and transferred to cloud-based irrigation management platforms for monitoring and analysis. In this system, the desired soil moisture is set in advance using the smart irrigation controller. When soil moisture falls below the set level, the system starts irrigating the corresponding area or zone. This is one of the major advantages of sensor-based systems, as they are more efficient than weather-based systems at providing precise irrigation for the field's respective zones. Hence, the sensor-based segment is gaining significant traction and contributing to the growth of the smart irrigation market in the forecast period.
The weather-based segment accounted for 35.64% revenue share in 2025. Weather-based irrigation systems continue to be relevant in residential areas and sports fields. They are also used in other spaces where the use of weather-based watering systems can be effective in irrigation management without the need for extensive field sensors.
By Application Insights
Based on application, the market is segmented into agricultural and non-agricultural. Significant demand is from agricultural applications because of the growing pressure to improve water productivity. At the same time, there is increasing non-agricultural demand from residential, commercial, and recreational spaces, as automation can improve efficiency and sustainability in these spaces.
Geographic Overview
The North America smart irrigation market led the global market with over 48% revenue share in 2025. This is due to the well-established agriculture industry in the US and Canada and the widespread adoption of connected irrigation technologies. The region is also experiencing the rise of sustainable landscaping practices. In addition, the region benefits from a high level of awareness of water-efficiency technology and digital infrastructure. The prominent irrigation technology companies’ presence contributes to the regional market's dominance.
Farmers in Asia, especially in India, face significant challenges in water management. Agriculture in India is one of the biggest users of the country’s freshwater resources. Groundwater depletion and the lack of irrigation infrastructure continue to affect the rate of water resource utilization in India. This is an opportune time for scalable irrigation technology and smart irrigation systems, which can control watering based on soil moisture and monitor the field remotely. As more people adopt smart irrigation systems, companies with affordable and mobile irrigation solutions are expected to gain traction in the price-sensitive agriculture sector.
There is also an opportunity in Europe in the area of sustainable farming practices, landscape water management, and the use of technology in agricultural and grounds maintenance operations. Latin America, as well as the Middle East & Africa, are emerging markets with opportunities in water management, modernization, and specific infrastructure investments.
Competitive Insights
Rain Bird Corporation, Hunter Industries, Galcon, Rachio, Weathermatic, The Toro Company, Soil Scout, Caipos, Netafim, Hydropoint, Manna Irrigation, Stevens Water Monitoring, Delta-T Devices, Calsense, Skydrop, and Aquaspy are some of the players operating in the smart irrigation market. Market competition is based on the intelligence of the irrigation controller, the accuracy of the sensors, the software, and the remote monitoring systems. Smart irrigation market companies are now differentiating themselves through digital platforms and analytics tools, mobile applications, and integration with fertigation systems and enterprise water management systems.
List of Key Companies
- Caipos
- Calsense
- Delta-T Devices
- Galcon
- Hunter Industries
- HydroPoint
- Manna Irrigation
- Netafim
- Rachio
- Rain Bird Corporation
- Skydrop
- Soil Scout
- Stevens Water Monitoring
- The Toro Company
- Weathermatic
Industry Developments
April 2025: Rain Bird Corporation announced the acquisition of OtO Inc. The company stated that the strategic move improves its ability to better serve a wider range of homeowners. OtO’s smart irrigation solutions align with Rain Bird’s mission to encourage the efficient use of water as a resource. The technology also helps Rain Bird expand its product line, as it offers homeowners the option of using automated irrigation systems without the hassle of installing underground systems.
October 2024: Netafim, part of Orbia and a leader in precision agriculture, launched GrowSphere and Orion PC. GrowSphere is a digital irrigation and fertigation system. It uses oT, cloud computing, and data analytics to automate irrigation based on real-time data and agronomic insights.
February 2024: HydroPoint announced the launch of HydroPoint 360. HydroPoint 360 is an enterprise water solution that offers data insights, waste forecasting, and industry-specific best practices.
November 2023: Hunter Industries Inc. launched the Hydrawise App. The company revealed that the app is an irrigation management software that provides enhanced control and insights to maintain a healthy landscape with minimal effort.
These developments are part of a larger shift in the market toward software-based irrigation management, predictive analytics, and connected control systems. Companies that deliver effective hardware solutions with user-friendly interfaces, along with practical agricultural information, are likely to improve their market positions.
Market Segmentation
By Component Outlook (Revenue, USD Billion, 2021–2034)
- Controllers
- ET-Based (Evapotranspiration)
- Soil Sensor-Based
- Sensors
- Soil Moisture Sensors
- Temperature Sensors
- Rain/Freeze Sensors
- Fertigation Sensors
- Others
- Water Flow Meters
- Others
By System Type Outlook (Revenue, USD Billion, 2021–2034)
- Weather-based
- Sensor-based
By Technology Outlook (Revenue, USD Billion, 2021–2034)
- IoT
- AI/ML
- GIS/GPS
By Application Outlook (Revenue, USD Billion, 2021–2034)
- Agricultural
- Greenhouses
- Open-fields
- Non-Agricultural
- Residential
- Turf & Landscape
- Golf Courses
- Others
By Regional Outlook (Revenue, USD Billion, 2021–2034)
- North America
- US
- Canada
- Europe
- Germany
- France
- UK
- Italy
- Spain
- Netherlands
- Russia
- Rest of Europe
- Asia Pacific
- China
- Japan
- India
- Malaysia
- South Korea
- Indonesia
- Australia
- Vietnam
- Rest of Asia Pacific
- Middle East & Africa
- Saudi Arabia
- UAE
- Israel
- South Africa
- Rest of Middle East & Africa
- Latin America
- Mexico
- Brazil
- Argentina
- Rest of Latin America
Smart Irrigation Market Report Scope
|
Report Attributes |
Details |
|
Market Size in 2025 |
USD 2.47 billion |
|
Market Size in 2026 |
USD 2.81 billion |
|
Revenue Forecast by 2034 |
USD 8.14 billion |
|
CAGR |
14.2% |
|
Base Year |
2025 |
|
Historical Data |
2021–2024 |
|
Forecast Period |
2026–2034 |
|
Quantitative Units |
Revenue in USD billion, and CAGR from 2026 to 2034 |
|
Report Coverage |
Revenue Forecast, Market Competitive Landscape, Growth Factors, and Trends |
|
Segments Covered |
|
|
Regional Scope |
|
|
Competitive Landscape |
Smart Irrigation Industry Trend Analysis (2025) Company profiles/industry participants profiling include company overview, financial information, product/service benchmarking, and recent developments |
|
Report Format |
PDF + Excel |
|
Customization |
Report customization as per your requirements with respect to countries, regions, and segmentation. |
FAQ's
The smart irrigation market stood at USD 2.47 billion in 2025. The market is projected to reach USD 8.14 billion by 2034.
The market is projected to account for a CAGR of 14.2% between 2026 and 2034.
The market is growing due to the rising usage of effective watering techniques for non-agricultural applications and the need for efficient use of water in emerging economies.
The sensor-based segment is expected to experience the fastest growth due to the increasing use of sensor-based automated systems in agricultural activities.
North America led the market in 2025 due to the well-established agriculture industry in the US and Canada and the widespread adoption of connected irrigation technologies.
Page last updated on:
Jan-2023
Research Methodology
A robust system of research, verification, and forecasting designed to ensure reliable and actionable market insights.
Polaris Market Research uses a clear and structured approach to deliver insights that clients can rely on. The process combines detailed primary and secondary research, including direct communication with industry experts. The detailed information helps build a complete picture of market trends and developments. Secondary data is gathered from credible sources such as industry reports, company filings, government source links, and trusted organization databases. It is then cross-checked through discussions with key stakeholders across the value chain. Market size and forecasts are developed using both bottom-up and top-down methods to ensure accuracy and consistency in the final results.

Project Setup
Step 1 & 2:
- We start every project by clearly understanding the client’s objective or goal, then defining the market scope, and aligning regions, segments, and timelines.
- Once the foundation is set, we collect data from all-around of sources, including company reports, government databases, and paid industry platforms.
- Our research is based on secondary data, which helps us build a strong understanding of the market across regions and industries. Then we validate this information through primary research by speaking directly with industry experts, companies, and stakeholders.
- By combining secondary and primary research, we ensure that our market insights are accurate, practical, and closely aligned with real market conditions.
Data Collection
We gather information from both public and verified sources:

Data Structuring
Step 3:
- All collected data is organized into a consistent format to ensure accurate analysis. Since inputs come from multiple sources, they are standardized and aligned before use.
- The data is segmented by product, application, and region, and mapped across a defined historical period (2020–2024). All values are converted into common units (USD Mn/Bn), and volume and pricing are aligned where required to estimate revenue.
- Any overlaps or inconsistencies are reviewed and adjusted to maintain accuracy (<5% variance threshold).
- The result is a structured dataset that allows for clear comparison across regions and supports reliable analysis and forecasting.
Structured Market Dataset, USD Mn/Bn

4. Data Structuring
Step 4: TOP-DOWN APPROACH
- We start with the overall market size at a global or macro level.
- The market is then narrowed down based on scope and industry relevance.
- We apply penetration rates and split the data by region and segment.
- This helps us estimate the market size for specific segments.
- The numbers are validated through cross-checks to ensure accuracy.

Step 5: BOTTOM-UP APPROACH
- We begin by analyzing data from leading companies in the market.
- Revenue data is collected and mapped across different segments.
- The data is then aggregated to estimate the total market size.
- To fill in any gaps, adjustments are made based on industry standards.
- Validation checks make sure that the results are correct.

5. Data Structuring
Step 6:
At Polaris Market Research, we employ a methodical forecasting strategy. This approach blends the analysis of historical data with real-time market validation. To forecast future trends with precision, we examine past patterns, pricing fluctuations, and the interplay of supply and demand. To ensure our conclusions reflect the present market landscape, we actively seek input from industry experts and key stakeholders.
To refine our predictions, we carefully consider critical elements such as market drivers and restraints, fluctuations in raw material costs, emerging technologies, and the production capabilities of various regions. Furthermore, we assess regulatory frameworks and potential policy shifts to gauge their potential impact on market expansion.
All this information is synthesized to generate precise forecasts for each segment and region. These forecasts illuminate the current state of the market and highlight forthcoming opportunities.

6. Data Structuring
Step 7:
In the final stage, we validate all our estimates using a triangulation method, where data is cross-checked from multiple reliable sources, like company data, primary interviews, and secondary research. This helps us make sure that our numbers are correct and fit with the rest of the market.
This process involves verifying data consistency across various segments and geographic areas. It also requires comparing historical trends with the assumptions support the forecast. Any discrepancies involve adjustments to ensure everything remains aligned and dependable.
Once the data is finalized, we prepare the final outputs, including market size estimates, segment-wise breakdowns, and growth metrics. These are delivered in structured formats such as tables, charts, and data files for easy analysis and use.
We collaborate closely with clients, ensuring the final products align with their requirements. This includes offering tailored adjustments, supplementary data analyses, and continuous assistance. Furthermore, we monitor market trends post-delivery, providing updates and refinements to maintain the insights' relevance as time passes.
Post-delivery, we continue to monitor market shifts, offering updates and adjustments to ensure the insights remain relevant over time.
Validation
Triangulation Framework
- Company-level data
- Primary inputs from industry participants
- Secondary benchmarks and published data
- Variance maintained within ±5-10%
- Adjustments applied to align estimates
- Segment values validated against overall market structure
Quality Check
Data Consistency & Integrity
- Segment totals validated to 100%
- Regional estimates aligned with global market size
- Historical trends compared against forecast outputs
- Assumptions reviewed for cross-segment and regional alignment
Output & Delivery
Final Outputs
- Market size estimates (USD Mn/Bn)
- Segment-wise distribution (%)
- Growth metrics (CAGR %)
- Structured tables and charts
- Segment-level datasets
- Excel-based data files for further analysis
Client Alignment & Support
- Deliverables are aligned with defined client requirements and scope
- Custom data cuts and segment splits are incorporated as required
- Post-delivery queries are addressed through analyst interactions
- Additional clarifications and data support are provided upon request
Client Continuity & Updates
- Market developments are tracked post-delivery to capture changes in key trends
- Updated data and revisions are provided based on new market inputs
- Additional refinements and data cuts are shared as required
- Continued analyst engagement supports evolving client requirements
