
Smart Transportation Market Demand, Global Analysis Report, 2025-2034
REPORT DETAILS
Market Statistics
Overview
The global smart transportation market size was valued at USD 136.05 billion in 2024, growing at a CAGR of 12.91% from 2025 to 2034. Key factors driving the market demand include the advancements in IoT & AI, environmental & sustainability goals, rising adoption of electric and autonomous vehicles, rapid urbanization, and increasing traffic congestion.
Key Insights
- In 2024, the traffic management system segment held 32% of global revenue share, driven by its major role in improving urban mobility and road safety.
- The professional services segment is poised for strong growth due to increasing complexities in deploying and maintaining smart solutions.
- North America dominated the sector with 33% of the global market share in 2024, supported by its robust technological infrastructure and early adoption of intelligent mobility systems.
- The U.S. led the North America landscape in 2024 due to its advanced tech ecosystem and early implementation of smart solutions.
- The Asia Pacific market is expected to grow the fastest, fueled by rapid urbanization, infrastructure expansion, and digital transformation initiatives.
- The market in India is experiencing notable growth as it prioritizes urban mobility improvements and digital infrastructure development.
Industry Dynamics
- Rising adoption of EVs and autonomous vehicles propels the requirement for intelligent charging networks and traffic systems. This would create major infrastructure upgrade opportunities, driving the industry expansion in the coming years.
- Rapid urbanization worsens traffic congestion, straining existing transport systems. Cities must invest heavily in smart solutions to handle rising mobility needs efficiently.
- High implementation costs and complex integration with legacy systems hinder widespread adoption, especially in developing regions with limited budgets and outdated infrastructure.
- Rising demand for AI-powered traffic optimization creates growth potential, particularly in megacities facing congestion, where governments are investing heavily in smart mobility solutions.
Market Statistics
- 2024 Market Size: USD 136.05 billion
- 2034 Projected Market Size: USD 456.92 billion
- CAGR (2025–2034): 12.91%
- North America: Largest market in 2024
Source: Polaris Market Research Analysis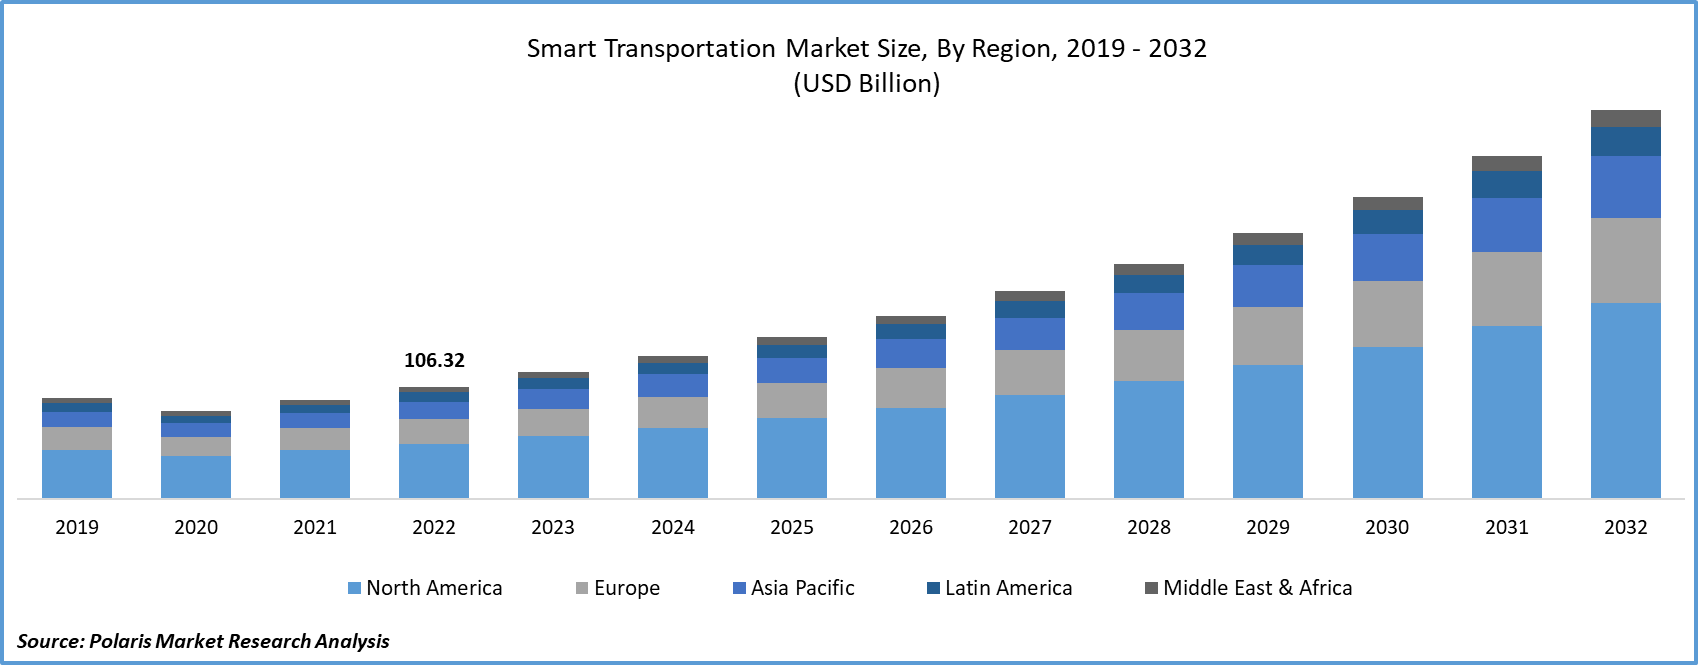
Want a Deeper Look at Key Market Players? Download Sample Report
AI Impact on Smart Transportation Market
- AI models analyze weather, traffic flow, and accident data to optimize signal timing and reduce congestion.
- Companies are shifting investments from physical infrastructure to AI-powered platforms that offer long-term upgradability.
- AI systems are increasingly deployed across cloud platforms and edge devices for real-time decision-making.
- Logistics companies adopt AI tools to forecast demand, optimize delivery routes, and reduce fuel consumption.
Smart transportation refers to the integrated application of modern technologies and intelligent systems to improve the efficiency, safety, and sustainability of transportation networks. These systems are increasingly adopting advanced technologies to enhance operational effectiveness as urbanization grows and demand for seamless mobility solutions increases. This transformation is fueled by the advancement in the Internet of Things (IoT). According to a March 2025 report by 5G Americas, the IoT market experienced growth, with 438 million new connections added in 2024, pushing the global total to 3.6 billion. IoT facilitates improved traffic management, reduced congestion, and predictive maintenance by enabling real-time data collection and communication between vehicles, infrastructure, and control centers. The ability of IoT technology to connect various transportation elements ensures optimized route planning, automated toll systems, and enhanced passenger experiences, making it indispensable to the evolution of intelligent mobility systems.
The growth of the smart transportation market is driven by the advancement in Artificial Intelligence (AI), which further contributes to the overall growth. AI algorithms, when integrated with transportation systems, enable dynamic decision-making based on real-time data analysis, supporting predictive traffic control, autonomous vehicle navigation, and incident detection. These technologies empower transport authorities to implement proactive strategies for crowd management and system resilience, especially in densely populated urban settings. AI-driven systems also contribute to the development of smart logistics and fleet management platforms, enhancing operational efficiency while reducing environmental impact. Together, IoT and AI are reshaping transportation infrastructure and laying the groundwork for future-ready, intelligent urban mobility ecosystems.
Drivers & Opportunities
Rising Adoption of Electric & Autonomous Vehicles: The rising adoption of electric and autonomous vehicles is driving the expansion opportunities, as it necessitates the development of intelligent infrastructure and digitally integrated mobility systems. Electric vehicles (EVs) demand the implementation of smart charging networks, energy-efficient routing, and grid optimization technologies, all of which are core components of a smart transportation ecosystem. According to a June 2024 IEA report, global electric car sales surpassed 17 million in 2024, capturing over 20% market share. Projections indicate sales will exceed 20 million in 2025. Simultaneously, autonomous vehicles rely on real-time data exchange, advanced sensors, and vehicle-to-everything (V2X) communication to operate safely and efficiently. These technological requirements accelerate the deployment of connected transportation systems, traffic management platforms, and supportive digital infrastructure, fostering widespread growth of smart mobility solutions.
Rapid Urbanization & Traffic Congestion: Rapid urbanization and increasing traffic congestion drive the need for smart transportation systems that efficiently manage growing mobility demands. A 2023 U.S. Department of Transportation report stated that 69% of MSAs recorded shorter daily congestion periods, averaging 17 minutes less than in 2022. Peak-day traffic worsened in 83% of regions, highlighting continued challenges during high-demand periods. Cities face escalating pressure on existing transport infrastructure, leading to longer commute times, higher emissions, and increased operational inefficiencies as urban populations expand. Smart transportation offers data-driven solutions such as adaptive traffic signal control, integrated public transit systems, and dynamic route optimization to alleviate congestion and improve urban mobility. These systems help streamline traffic flow, reduce delays, and enhance the commuter experience, positioning them as a critical response to the evolving challenges of urban development.
Source: Polaris Market Research Analysis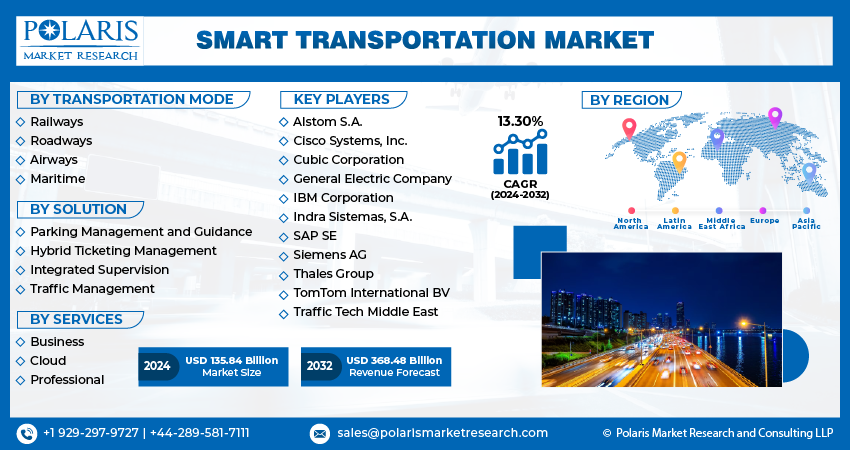
Get Full Segment-Level Forecasts & Insights: Download Sample Report
Segmental Insights
Solution Analysis
Based on solution, the segmentation includes indoor ticketing management system, parking management system, integrated supervision system, and traffic management system. The traffic management system segment accounted for 32% of global revenue share in 2024 due to its critical role in optimizing urban mobility and enhancing road safety. The demand for efficient traffic flow, reduced congestion, and minimized travel times has become increasingly important as urban centers continue to grow. Traffic management systems leverage real-time data analytics, AI-based signal control, and intelligent surveillance to monitor and regulate transportation networks. Their integration with connected infrastructure enables dynamic route adjustments and incident response, making them a central pillar of smart transportation strategies. The ability to deliver immediate operational benefits has positioned this segment as a leading solution in global smart mobility initiatives.
Service Analysis
In terms of service, the segmentation includes cloud services, business services, and professional services. The professional services segment is expected to witness significant growth during the forecast period, driven by the rising complexity of implementing and managing smart systems. These services encompass system integration, consulting, maintenance, and training, all of which are essential for ensuring seamless deployment and sustained performance of intelligent mobility solutions. Stakeholders aim for professional expertise to align technical frameworks with regulatory requirements and operational goals as advanced technologies are increasingly adopted across transportation infrastructures. The growing reliance on customized service delivery models further enhances the demand for specialized support, solidifying the growth trajectory of the professional services segment.
Source: Polaris Market Research Analysis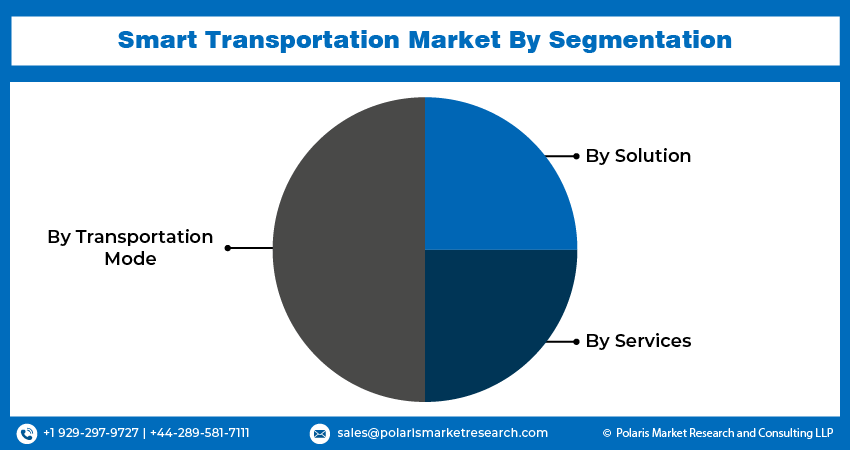
Need Granular Data Across All Market Segments? Request Customization
Regional Analysis
The North America smart transportation market accounted for 33% of global market share in 2024, This dominance is attributed to reflecting its strong technological infrastructure and early adoption of intelligent mobility solutions. The region’s dominance is supported by widespread deployment of connected vehicle systems, advanced traffic monitoring platforms, and integrated urban mobility frameworks. Additionally, proactive investments in smart infrastructure and robust collaboration between public agencies and private players have accelerated the modernization of transportation networks. North America's focus on sustainable urban development and real-time traffic solutions continues to position it as a leading market for innovation.
U.S. Smart Transportation Market Insights
The U.S. held a significant market share in North America smart transportation landscape in 2024 due to its advanced technological infrastructure and early deployment of intelligent mobility solutions. Strategic investments in connected vehicle technologies, integrated traffic management systems, and smart urban transit have strengthened the country’s leadership in the regional market. Moreover, public-private collaborations and a strong policy push for sustainable and data-driven transportation further reinforced the U.S.'s dominant position.
Asia Pacific Smart Transportation Market Trends
The market in Asia Pacific is projected to witness the fastest growth during the forecast period, driven by rapid urbanization, increasing infrastructure development, and growing focus on digital transformation. Rising demand for efficient transportation systems to accommodate expanding metropolitan populations is encouraging the adoption of smart mobility solutions across the region. Governments and city planners are investing in intelligent traffic systems, smart public transit, and integrated urban planning to address congestion and enhance the commuter experience. The surge in technology adoption, coupled with supportive policy frameworks, is accelerating the region’s transition toward connected and sustainable transport ecosystems.
India Smart Transportation Market Overview
The market in India is expanding due to growing emphasis on urban mobility reform and digital infrastructure development. Government initiatives aimed at modernizing public transportation, along with the adoption of intelligent traffic control systems and smart parking solutions, are driving growth. Furthermore, the rise in demand for integrated mobility platforms and real-time transportation services is shaping a favorable environment for advancements in the country.
Europe Smart Transportation Market Outlook
The smart transportation landscape in Europe is projected to hold a substantial share in 2034, owing to its strong regulatory support for sustainable mobility and established infrastructure. The region’s strategic focus on reducing emissions, improving public transportation, and deploying smart city frameworks drives the integration of advanced transportation technologies. Europe’s commitment to smart, inclusive, and green mobility highlights its sustained investments in intelligent transportation systems, ensuring its prominent position in the global landscape. In July 2025, the European Commission allocated approximately USD 3 billion through the Connecting Europe Facility (CEF), selecting 94 strategic transport infrastructure projects for funding. Collaborative initiatives among European nations and funding programs aimed at digital infrastructure expansion further support long-term market growth.
UK Smart Transportation Market Assessment
The growth of the UK smart transportation market is driven by the country’s strategic focus on building sustainable and digitally connected mobility systems. Investments in modernizing public transport infrastructure, alongside the integration of intelligent traffic and transit management technologies, are supporting this transition. Additionally, the UK’s policy alignment with low-emission and smart city initiatives is accelerating the adoption of advanced transportation solutions tailored to urban and regional needs.
Source: Polaris Market Research Analysis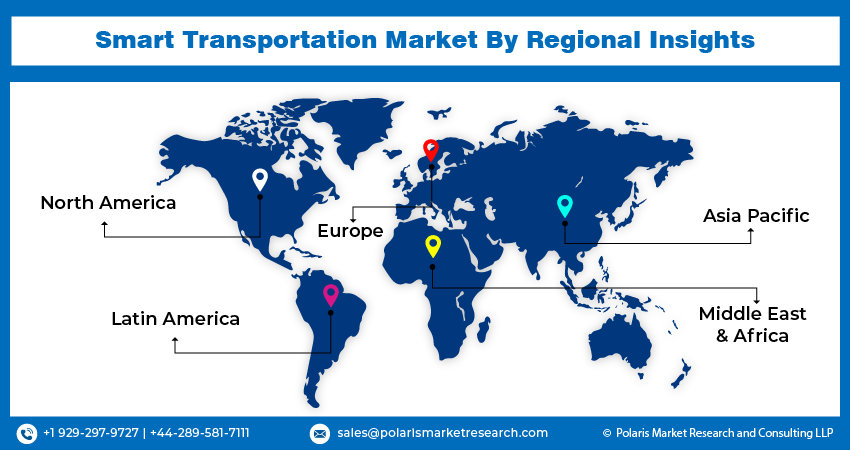
Curious About Regional Market Performance? Request Customization
Key Players & Competitive Analysis
The smart transportation sector is witnessing intense competition fueled by emerging technologies and strategic investments across developed and emerging markets. Companies are leveraging competitive intelligence to capitalize on revenue opportunities, with a focus on sustainable value chains and future development strategies. Disruptions and trends, such as AI-driven mobility solutions and EV integration, are reshaping the industry, while economic and geopolitical shifts influence region-wise market size and expansion opportunities. Large corporations dominate with vendor strategies centered on technological advancements, but small and medium-sized businesses are gaining traction through niche innovations. Growth projections highlight latent demand in urban mobility and logistics, with expert insights emphasizing the need for strategic alliances to address supply chain disruptions. As industry trends evolve, companies must prioritize revenue growth analysis and competitive positioning to navigate this dynamic landscape.
A few major companies operating in the smart transportation industry include Accenture PLC, Alstom SA, Cisco Systems Inc., Cubic Corporation, General Electric Company (GE), Indra Sistemas S.A., International Business Machines Corporation (IBM), Kapsch, LG CNS Corporation, and Xerox Holdings Corporation.
Key Players
- Accenture PLC
- Alstom, SA
- Cisco System, Inc.
- Cubic Corporation
- General Electric Company (GE)
- Indra Sistema S.A.
- International Business Machines Corporation
- Kapsch
- LG CNS Corporation
- Xerox Holdings Corporation
Smart Transportation Industry Developments
- October 2025: Cubic deployed a smart ticketing solution for Tasmania’s public transport network, aiming to modernize fare collection and enhance overall service efficiency across the state.
- March 2025: Huawei launched seven smart transportation solutions, enhancing efficiency and sustainability across rail, aviation, road, and sea ports. Key improvements include faster incident detection, energy savings up to 40%, and AI-driven operational optimizations, aiming to modernize infrastructure without promotional claims.
- August 2024: NoTraffic partnered with SWARCO McCain to deploy AI-powered traffic management solutions, initially targeting the U.S. West Coast. The collaboration aims to enhance urban mobility through intelligent transportation systems, offering cities and DOTs advanced tools for optimizing traffic operations.
- November 2023: FirstGroup plc partnered with Hitachi ZeroCarbon Ltd to accelerate the UK’s transition toward electric buses under FirstGroup’s fleet decarbonization strategy. This collaboration focuses on supplying advanced battery solutions to support the expansion of First Bus’s electric fleet, strengthening sustainable transport infrastructure while improving air quality and enhancing overall passenger experience.
Smart Transportation Market Segmentation
By Solution Outlook (Revenue, USD Billion, 2020–2034)
- Ticketing Management System
- Parking Management System
- Integrated Supervision System
- Traffic Management System
By Service Outlook (Revenue, USD Billion, 2020–2034)
- Cloud Services
- Business Services
- Professional Services
By Regional Outlook (Revenue, USD Billion, 2020–2034)
- North America
- U.S.
- Canada
- Europe
- Germany
- France
- UK
- Italy
- Spain
- Netherlands
- Russia
- Rest of Europe
- Asia Pacific
- China
- Japan
- India
- Malaysia
- South Korea
- Indonesia
- Australia
- Vietnam
- Rest of Asia Pacific
- Middle East & Africa
- Saudi Arabia
- UAE
- Israel
- South Africa
- Rest of Middle East & Africa
- Latin America
- Mexico
- Brazil
- Argentina
- Rest of Latin America
Smart Transportation Market Report Scope
| Report Attributes | Details |
| Market Size in 2024 | USD 136.05 Billion |
| Market Size in 2025 | USD 153.23 Billion |
| Revenue Forecast by 2034 | USD 456.92 Billion |
| CAGR | 12.91% from 2025 to 2034 |
| Base Year | 2024 |
| Historical Data | 2020–2023 |
| Forecast Period | 2025–2034 |
| Quantitative Units | Revenue in USD Billion and CAGR from 2025 to 2034 |
| Report Coverage | Revenue Forecast, Competitive Landscape, Growth Factors, and Industry Trends |
| Segments Covered |
|
| Regional Scope |
|
| Competitive Landscape |
|
| Report Format |
|
| Customization | Report customization as per your requirements with respect to countries, regions, and segmentation. |
Source: Polaris Market Research Analysis
Smart Transportation Market FAQ's
The global market size was valued at USD 136.05 billion in 2024 and is projected to grow to USD 456.92 billion by 2034.
The global market is projected to register a CAGR of 12.91% during the forecast period.
North America accounted for 33% of global market share in 2024.
A few of the key players in the market are Accenture PLC, Alstom SA, Cisco Systems Inc., Cubic Corporation, General Electric Company (GE), Indra Sistemas S.A., International Business Machines Corporation (IBM), Kapsch, LG CNS Corporation, and Xerox Holdings Corporation.
The traffic management system segment accounted for 32% of global revenue share in 2024
The professional services segment is expected to witness significant growth during the forecast period
Download Sample Report of Smart Transportation Market
Please fill out the form to request a customized copy of the research report.
