
Software Defined Data Center Market Share & Growth Analysis, 2025-2034
REPORT DETAILS
Market Statistics
Market Overview
The software defined data center market size was valued at USD 77.44 billion in 2024, and it is estimated to reach USD 470.54 billion by 2034, exhibiting a CAGR of 19.8% from 2025–2034. Businesses are adopting them to improve flexibility and control over IT resources. As cloud computing becomes more widespread, companies want infrastructure that can quickly adapt to changing needs. SDDCs enable easier data management, lower costs, and support modern digital operations across various industries.
The SDDCs market growth can be attributed to the rising demand for virtualization to simplify business operations. Virtualization helps organizations make the most of their computing, storage, and network resources, improving operational efficiency. Businesses are looking to cut hardware costs and enhance their skills, and virtualization technologies allow for seamless resource allocation, quick application deployment, and centralized management. This shift simplifies IT operations and aligns with the increasing trend toward hybrid and multi-cloud strategies. By converting physical infrastructure into a flexible, software-driven environment, organizations can easily adjust to changing demands and streamline processes.
Source: Polaris Market Research Analysis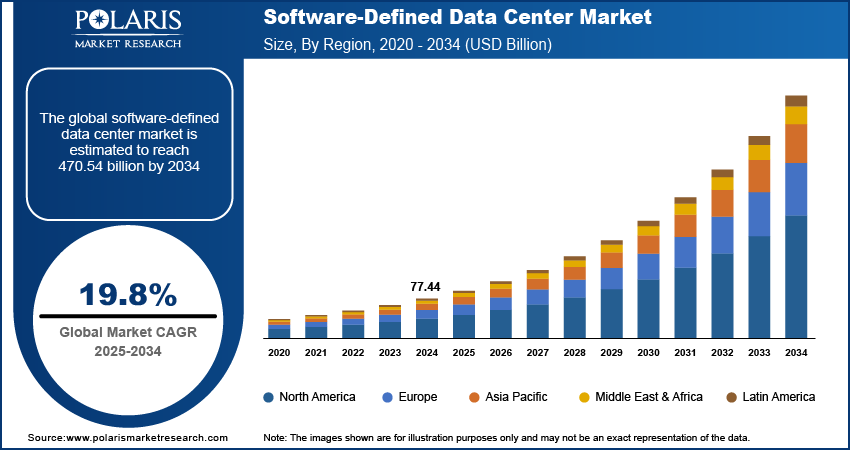
To Understand More About this Research: Download Sample Report
Organizations are increasingly adopting these solutions as they help cut operational costs by optimizing resource usage and reducing hardware investments. This approach allows businesses to adjust resources based on demand, enabling rapid growth without significant capital expenditure. The flexibility of these solutions makes it easier to manage workloads, supports hybrid cloud strategies, and improves overall operational efficiency. Thus, as companies look for greater skill and efficiency in their IT environments and focus on cost cutting measures, the adoption of SDDC solutions is significantly accelerating, fueling the software defined data center market expansion.
Market Drivers
Increasing Adoption of Cloud Computing
The use of cloud computing has transformed the way organizations manage their IT infrastructure. Businesses are increasingly adopting cloud solutions, for which they seek integrated environments that allow seamless resource management across public, private, and hybrid clouds. According to the India Brand Equity Foundation, in India, end-user spending on cloud services increased to USD 7.1 billion in 2022 from USD 5.6 billion in 2021, highlighting the growing reliance on cloud technologies. This shift enhances flexibility and scalability, as well as encourages organizations to streamline operations and reduce costs. Thus, the rise in adoption of cloud computing is significantly driving the market growth.
Rising Integration of Digital Technologies
Companies across various industries integrate a variety of digital technologies in their business operations. According to the United Nations, digital technologies have advanced more rapidly than any innovation, reaching around 50% of the developing world’s population in just two decades. This increase necessitates flexible and scalable IT infrastructure to support diverse applications and data workloads. Software defined data center solutions offer the agility and efficiency required to manage this digital transformation, enabling businesses to respond quickly to market demands and enhance operational efficiency. Therefore, the increasing use of digital technologies is positively impacting the market demand.
Source: Polaris Market Research Analysis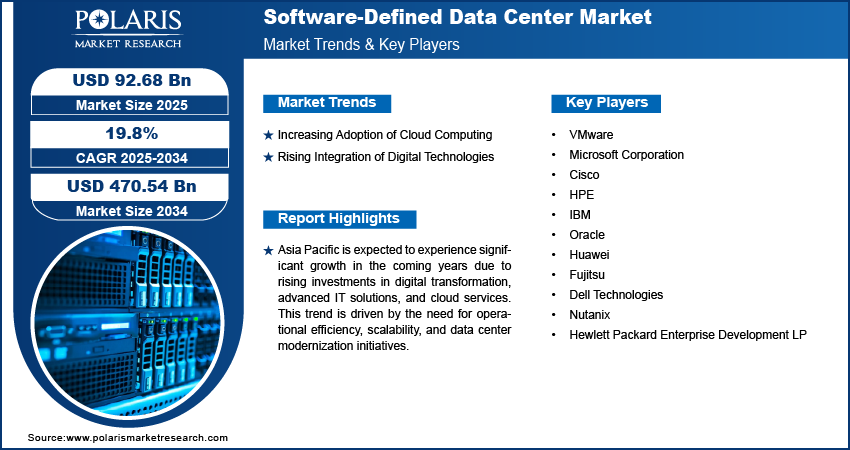
Get Full Segment-Level Forecasts & Insights: Download Sample Report
Market Segment Insights
Offering Insights
The services segment is expected to experience a higher CAGR in the global market during the forecast period. This growth is attributed to the increasing demand for managed services, cloud integration, and support solutions as organizations seek to streamline their IT operations. As businesses adopt these solutions, they will increasingly rely on expert services for implementation, optimization, and ongoing management, driving the segment's growth in the global market.
Model Insights
The software-defined computing segment is expected to dominate the market during the forecast period due to the growing need for efficient resource management and improved performance in IT environments. As organizations increasingly virtualize their computing resources, they benefit from enhanced scalability, flexibility, and reduced operational costs. The rise of cloud computing and digital transformation initiatives further boost the adoption of software-defined computing solutions, impacting the segmental growth in the global market.
Source: Polaris Market Research Analysis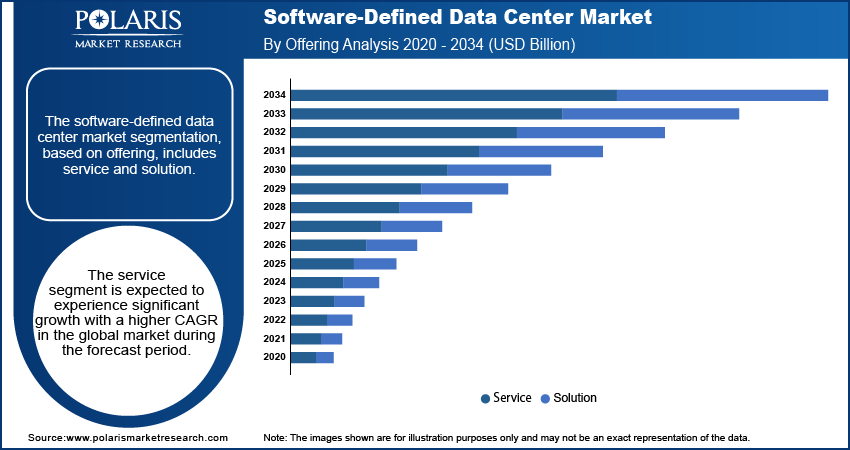
Need Granular Data Across All Market Segments? Request Customization
Regional Insights
In 2024, North America software defined data center market held the largest revenue share of the market due to the presence of major players and the early adoption of data automation and cloud computing technologies. The region benefits from a well-established IT infrastructure and a strong ecosystem that encourages innovation and investments in advanced solutions. Organizations across the region are increasingly leveraging SDDCs to enhance operational efficiency, scalability, and flexibility, leading to the software-defined market development in North America.
Source: Polaris Market Research Analysis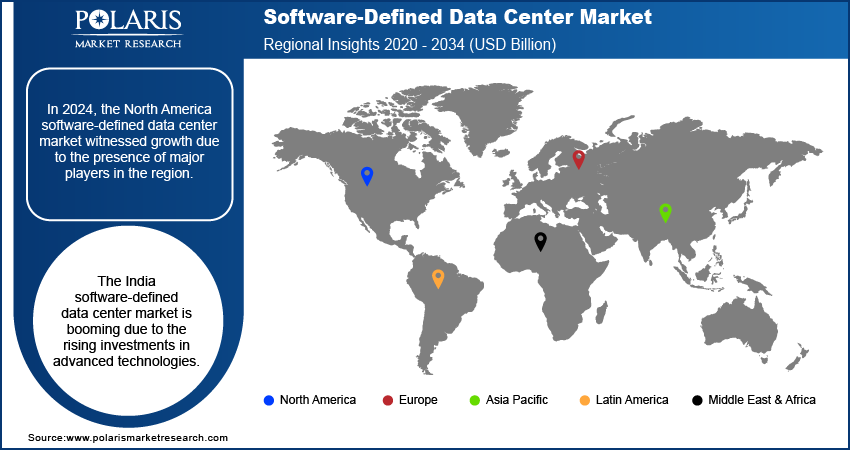
Curious About Regional Market Performance? Request Customization
Asia Pacific is projected to register a substantial CAGR during the forecast period, driven by increasing investments from end users across various industries, particularly in IT infrastructure, cloud services, and data center modernization. As organizations in the region recognize the importance of digital transformation, they are allocating significant resources to adopt advanced IT solutions. The need for enhanced operational efficiency, scalability, and cost-effectiveness is fueling this trend. Additionally, the growing demand for cloud services and modernization of data centers are key factors contributing to the market expansion in Asia Pacific.
The market in India is expected to experience substantial growth due to increasing investments in technology adoption. According to the India Brand Equity Foundation, by 2047, the country aims for a USD 26 trillion GDP, driven by a growing digital economy and significant cloud computing investments. This environment fosters innovation and strengthens infrastructure, making these solutions essential for enterprises seeking agility, scalability, and efficiency in their operations.
Key Players and Competitive Insights
The SDDC market is constantly evolving, with numerous companies striving to innovate and distinguish themselves. Leading global corporations dominate the market by leveraging extensive research and development, advanced software technologies, and significant capital to maintain a competitive edge. These companies pursue strategic initiatives such as mergers and acquisitions, partnerships, and collaborations to enhance their product offerings and expand into new markets.
New companies are impacting the industry by introducing innovative medical devices and meeting the needs of specific sectors. This competitive environment is amplified by continuous progress in product offerings and new components, greater emphasis on sustainability, and the rising requirement for tailor-made products in diverse industries. A few major players in the market are VMware, Microsoft Corporation, Cisco, HPE, IBM, Oracle, Huawei, Fujitsu, Dell Technologies, Nutanix, and Hewlett Packard Enterprise Development LP.
Microsoft is a multinational technology company headquartered in Redmond, Washington. The company offers a wide range of products and services, including operating systems, productivity software, gaming consoles, and cloud-based solutions. Its most well-known product is Microsoft Windows, which is the most widely used operating system in the world. Other popular products include Microsoft Office, Skype, and the Xbox gaming console. In recent years, Microsoft has heavily invested in artificial intelligence (AI) and machine learning technologies. The company has been using AI to enhance its products and services, as well as developing new AI-based applications. For example, Microsoft's Cortana virtual assistant utilizes machine learning to provide personalized recommendations and insights to users. Additionally, the company has created various AI-based products and services, such as the Azure Machine Learning platform, which enables developers to build, deploy, and manage machine learning models at scale. The company has also developed AI tools for healthcare, such as the Microsoft Healthcare Bot, which assists patients in getting answers to their health-related questions. In December 2023, Windows Server 2019 was released with advanced features such as Storage Spaces Direct and Software Defined Networking. Users were advised to deploy on WSSD-certified hardware for optimal performance and support. An update was recommended for seamless integration.
IBM, the International Business Machines Corporation, is an American multinational technology company that operates in over 75 countries. It is the largest technology firm across the world and the second most valuable global brand. The company primarily sells software, which accounts for 29% of its revenue. Infrastructure deployments make up 37%, while the hardware segment constitutes 8%, and IT Deployments represent 23%. IBM has a vast network of 80,000 business associates who assist in serving 5,200 clients, including 95% of the Fortune 500. Despite being a B2B (business-to-business) firm, IBM has significant external influence. It is responsible for 50% of all wireless and 90% of all credit card transactions.
Key Companies
- VMware
- Microsoft Corporation
- Cisco
- HPE
- IBM
- Oracle
- Huawei
- Fujitsu
- Dell Technologies
- Nutanix
- Hewlett Packard Enterprise Development LP
Industry Developments
- In May 2025: Hewlett-Packard Enterprise expanded its HPE Aruba Networking portfolio with the Aruba CX 10K distributed services switches. With integrated AMD Pensando DPUs, these switches offload network and security tasks from CPUs, freeing compute resources for demanding AI workloads. This upgrade aims to enhance efficiency and scalability in modern data center infrastructures.
- In April 2025: Dell Inc. launched its PowerFlex software-defined storage solution integrated with the Nutanix Cloud Platform and Nutanix Cloud Infrastructure through a strategic collaboration. Announced last year, the joint solution is now commercially available, supporting NCP and Nutanix’s native hypervisor AHV in a scalable two-tier architecture, offering improved flexibility and performance for enterprise hybrid cloud deployments.
- In August 2024: Broadcom unveiled VMware Cloud Foundation 9, a streamlined private cloud platform designed for enterprises. New features were highlighted to enhance management and simplify the deployment of virtualized workloads.
- In December 2023: Rackspace Technology announced the launch of its SAP-certified software defined data center solutions, powered by VMware and Dell VxRail, providing a turnkey experience for mission-critical environments and enhancing cloud management capabilities.
Market Segmentation
By Offering Outlook (USD Billion, 2020–2034)
- Solution
- Services
By Model Outlook (USD Billion, 2020–2034)
- Software-Defined Computing
- Software-Defined Storage
- Software-Defined Networking
- Software-Defined Operations
By Enterprise Size Outlook (USD Billion, 2020–2034)
- Small and Medium Enterprise
- Large Enterprise
By End User Outlook (USD Billion, 2020–2034)
- Cloud Service Provider
- Managed Service Provider
- Telecom Service Providers
By Regional Outlook (USD Billion, 2020–2034)
- North America
- US
- Canada
- Europe
- Germany
- France
- UK
- Italy
- Spain
- Netherlands
- Russia
- Rest of Europe
- Asia Pacific
- China
- Japan
- India
- Malaysia
- South Korea
- Indonesia
- Australia
- Rest of Asia Pacific
- Middle East & Africa
- Saudi Arabia
- UAE
- Israel
- South Africa
- Rest of Middle East & Africa
- Latin America
- Mexico
- Brazil
- Argentina
- Rest of Latin America
Market Report Scope
| Report Attributes | Details |
| Market size value in 2024 | USD 77.44 billion |
| Market size value in 2025 | USD 92.68 billion |
| Revenue Forecast by 2034 | USD 470.54 billion |
| CAGR | 19.8% from 2025 to 2034 |
| Base Year | 2024 |
| Historical Data | 2020–2023 |
| Forecast Period | 2025–2034 |
| Quantitative Units | Revenue in USD billion and CAGR from 2025 to 2034 |
| Report Coverage | Revenue Forecast, Market Competitive Landscape, Growth Factors, and Trends |
| Segments Covered |
|
| Regional Scope |
|
| Competitive Landscape |
|
| Report End-User |
|
| Customization | Report customization as per your requirements with respect to countries, region, and segmentation. |
Source: Polaris Market Research Analysis
Software Defined Data Center Market FAQ's
The software-defined data center market value reached USD 77.44 billion in 2024 and is projected to grow to USD 470.54 billion by 2034
The global market is projected to record a CAGR of 19.8% during 2025–2034.
North America held the largest share of the global market in 2024.
A few key players in the market are VMware, Microsoft Corporation, Cisco, HPE, IBM, Oracle, Huawei, Fujitsu, Dell Technologies, Nutanix, and Hewlett Packard Enterprise Development LP.
The service offering is anticipated to experience substantial growth with a significant CAGR in the global market. This growth is attributed to the increasing demand for consulting and implementation.
The software-defined computing segment is expected to dominate the market during the forecast period due to rising demands for efficient resource management, scalability, and cost reduction amid increasing virtualization and cloud adoption.
Download Sample Report of Software Defined Data Center Market
Please fill out the form to request a customized copy of the research report.
