

Market Overview
The global solar panels market was valued at USD 183.6 billion in 2024 and is projected to register a CAGR of 14.80% from 2025 to 2034. Growth is supported by the increasing adoption of renewable energy and falling costs of solar technology. Governments worldwide are implementing various initiatives, including favorable policies, incentives, and subsidies, to accelerate the adoption of renewable energy solutions. This factor propels the demand for solar panels.
Key Insights
- The crystalline silicon segment dominated the market in 2024. The dominance is attributed to its high efficiency, reliability, long-term performance, and reduced manufacturing costs.
- The polycrystalline segment held the largest share in 2024. Polycrystalline panels are experiencing high demand due to their simpler production process. It generates minimal waste and utilizes lower-quality silicon, making it an affordable solution.
- The on grid connectivity type dominated the solar panels industry in 2024 due to the absence of batteries in the on-grid system.
- The ground-mounted solar panels segment led revenue share in 2024, due to their ability to yield greater energy production per panel.
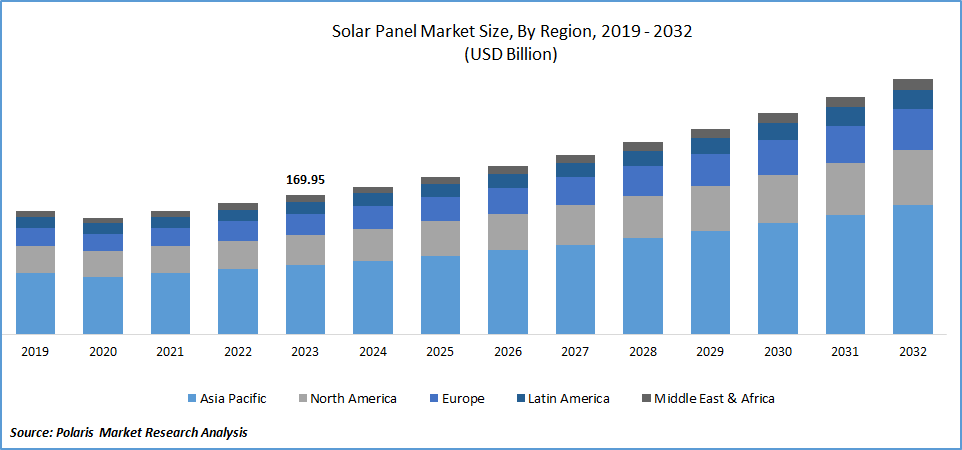
- Asia Pacific led the global market in 2024. The increasing use of solar PV modules in various utility-scale, residential, and commercial applications contributes to regional industry growth.
- The industry in Europe is anticipated to register the highest CAGR during the forecast period. The growth is driven by the increasing consumer demand for clean energy and rising emphasis on reducing greenhouse gas emissions by implementing solar energy.
Industry Dynamics
- There is a growing demand for renewable energy sources, as natural resources continue to be depleted. This factor drives the requirement for solar panels.
- Growing investments in clean energy solutions from governments and private companies across the world propel the industry expansion.
- High manufacturing and installation costs of solar panels hinder the adoption of solar panels.
- There is an increasing adoption of smart solar systems integrated with technologies, including AI and IoT. This is expected to provide lucrative opportunities in the coming years.
Market Statistics
2024 Market Size: USD 183.6 billion
2034 Projected Market Size: USD 732.7 billion
CAGR (2025–2034): 14.80%
Asia Pacific: Largest market in 2024
AI Impact on Solar Panels Market
- Artificial intelligence (AI) technology is used to optimize panel orientation, tilt, and tracking systems. It helps increase solar energy production.
- AI tools schedule maintenance and provide predictions on equipment failures, which reduces downtime.
- These tools analyze site-specific data and satellite imagery to optimize panel placement. It improves energy production.
- AI-enabled simulations help industry players understand system performance and make effective design decisions.
- The technology helps fill in the energy demand and supply gap, as it enables better grid connectivity and storage management.
To Understand More About this Research:Download Sample Report
The solar panels market refers to the industry involved in the manufacturing, distribution, and installation of photovoltaic modules designed to convert sunlight into electricity. This market encompasses a range of technologies and applications aimed at harnessing solar energy for residential, commercial, and industrial use. The growing consumer energy demand and a surge in the number of people switching towards renewable energy sources have raised the demand for solar panels in the home rooftop solar industry. This rise is being fueled by the declining cost of producing solar cells utilizing materials like polysilicon and silver.
Businesses in this sector are focusing on creating new technologies with enhanced production techniques and capacities to lower their operating expenses and carbon footprint, which is expected to spur market expansion in the near future. Solar panels market advancement will further be fueled by the numerous governments worldwide that are implementing policies and providing incentives to promote the use of solar panels. For instance, In February 2024, the Delhi government, under the Delhi Solar Policy 2024, aimed to accurately analyze sunlight patterns using satellite imagery to calculate the power generation potential of rooftops. This policy encourages residents to install solar panels by offering generation-based incentives, capital subsidies, and the opportunity to sell excess electricity.
Thin-film solar panels are anticipated to contribute to maximizing sales as they are energy-efficient for a wide range of residential and industrial applications, including consumer electronics, military, and space. These panels are widely used to generate power, especially in locations where conventional solar cells are impractical. The need for highly flexible and eco-friendly products has also risen as a key consequence of establishing several regulations and strict energy norms that have positively influenced the global market.
Market Dynamics
Rising Need for Renewable Energy Sources is Creating Demand in the Market
Demand for renewable energy is rising as natural resources continue to deplete, causing damaging effects on the environment. Individuals are adopting sustainable energy solutions – solar panels are an appealing alternative due to their numerous benefits over conventional energy sources. Additionally, the increase in the installation of solar systems, specifically the ongoing decline in the costs of solar cell modules, rapid urbanization, and augmented consumer spending, has affected market growth positively. It is anticipated that the demand for solar panels will continue to rise as a result of these benefits, especially in regions with a high concentration of water bodies.
Rising Investments in the Renewable Energy Sector Notably Drive Market Growth
Renewable energy has seen a rise in global investments due to its decreased carbon emissions and relatively affordable manufacturing prices. The industry is expected to grow and innovate, raising production capacity, cutting costs, and boosting product efficiency as more investors pour money into the development and manufacturing of solar panels. As a result, customers can access and afford solar energy, which is propelling the expansion of the solar panels market.
Global Annual Investment in Power Generation by Solar PV, 2021–2024e
|
2021 |
2022 |
2023 |
2024 (Estimated) |
|
USD 250 billion |
USD 360 Billion |
USD 470 Billion |
USD 500 Billion |
(Source: IEA)
Major Investments in Solar Panel Manufacturing /Solar Companies
|
Investor / Company |
Date |
Investment / Project |
Key Details & Impacts |
|
Aukera Energy |
November 2025 |
Aukera Energy secured a €60 million debt facility from Kommunalkredit Austria AG to finance the construction of its battery energy storage system in Romania. |
The 250 MW 500 MWh battery storage project, located in Gura Ialomitei, Ialomita County, is expected to be delivered in two phases. Phase one construction is underway. The full project is expected to be operational by mid-2026. |
|
Solex Energy (India) |
October 2025 |
Solex announced that it aims to invest $1.5 billion by 2030 to expand manufacturing. |
The company targets exports to the U.S. It operates a 4 GW module manufacturing facility in Gujarat, India. It plans to boost its capacity to 10 GW. It also aims to establish 2 GW of ingot and wafer production and 10 GW of cell manufacturing. |
|
Origis Energy |
January 2025 |
Origis Energy announced a strategic investment from Brookfield Asset Management Ltd. alongside new commitments from Antin Infrastructure Partners. The investment could exceed $1 billion in the aggregate. |
It will help Origis Energy provide cost-effective and clean electricity across the U.S. |
|
Qcells (Hanwha) |
January 2023 |
Investment of USD 2.5 billion in building a Complete Solar Supply Chain across the U.S. |
It aims to have 8.4 gigawatts of solar panel production capacity by 2024. The company aims to create nearly 2,500 jobs in the clean energy sector in Georgia. |
Market Restraints
Cost of Manufacturing and Installing Solar Panels Remains Relatively High
Solar panel installation has a high cost, which acts as the main limiting factor in the industry for solar panels. For the purpose of installing the panels, a specific quantity of land must be set aside. This requirement for land is directly proportional to the energy. Some consumers may find it difficult to justify the initial outlay necessary to convert to solar power. After the panels are installed, the area cannot be used for any other purpose, which limits the growth of the solar panel. Improvement in the efficiency of solar panels will lead to better efficiency and cost-effectiveness.
Report Segmentation
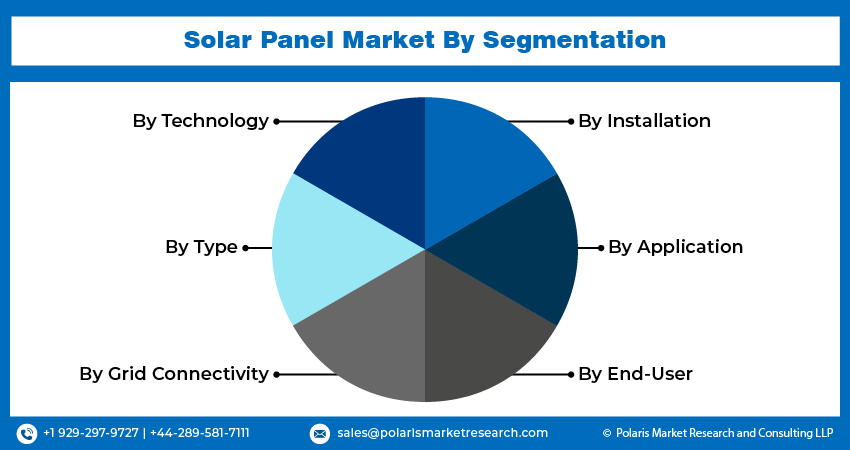
The market is primarily segmented based on technology, type, grid connectivity, installation, application, end user, and region.
|
By Technology |
By Type |
By Grid Connectivity |
By Installation |
By Application |
By End User |
By Region |
|
|
On grid Off grid |
|
|
|
|
To Understand the Scope of this Report:Request Customization
Segmental Analysis
By Technology Analysis
- The crystalline silicon segment has dominated the solar panels market for years and is anticipated to lead the industry during the forecast period. This segment has seen significant growth due to ongoing technological advancements in solar PV. Its high efficiency, reliability, long-term performance, and reduced manufacturing costs drive the solar panels market growth. Silicon is easily available in abundance and at a relatively cheaper rate.
- The concentrated solar power technology segment is anticipated to grow due to its capability of storing heat energy that can be utilized in the absence of sunlight, overcoming the limitation of solar power's intermittent nature. This technology directly aims at converting solar radiation into electricity, but it is yet to be adopted to its full potential due to cost concerns.
By Type Analysis
- The polycrystalline panels, referred to as the ‘multicrystalline panels’ segment, dominated the solar panels market. They are well accepted due to their less complicated production process with minimal waste and use of lower-quality silicon, which makes them an affordable solution. However, they require slightly more space to produce the same amount of energy.
- The concentrated PV (Photovoltaic) cells segment is projected to grow at the fastest CAGR due to its low cost of energy. Low-cost production is due to less requirement of PV material during manufacturing. Formation of hot spots is possible with concentrated sunlight, produced by using inexpensive concentrating optics.
By Grid Connectivity Analysis
- On grid connectivity type has dominated the solar panels market and is expecting higher revenue growth. It is easy to maintain due to the absence of batteries in the on-grid system, which eliminates the need for the user to purchase a costly battery backup to store extra energy and significantly saves on power bills.
- The off-grid connectivity type is anticipated to experience significant growth in the coming years, driven by the growing demand for solar panels in residential, industrial, and commercial settings due to increased awareness. These have smaller market shares due to their limited applications and higher costs for energy storage systems but hold the potential to expand.
By Installation Analysis
- The ground-mounted solar panels segment dominated the solar panels market due to their ability to yield greater energy production per panel. They act as an alternative to traditional rooftop installations. They offer easy placement and customization of angle and orientation to optimize solar energy harvesting.
- The rooftop solar panel segment is projected to grow at the fastest CAGR. The adoption rate of solar rooftop panels is accelerating as they offer cost savings. Calculating the price of electricity generated by solar rooftops is easy. The government offers tax credits to those who install rooftop solar panels to aid in reducing their carbon footprint. For instance, in June 2024, the federal solar tax credit, known as the solar investment tax credit (ITC), offers homeowners a substantial incentive to invest in solar power systems in the US. Currently, eligible individuals can claim 30% of their total solar PV system costs as a tax credit, encouraging widespread adoption of renewable energy solutions.
By Application Analysis
- The commercial segment has dominated the market share due to its cost savings, environmental preservation, and sustainability benefits. Technological advancements and increasing investments in renewable energy are driving the growth of the commercial segment, making it an attractive choice for businesses.
- The residential segment is anticipated to grow significantly as residential buildings are adopting rooftop solar PV systems with energy storage systems, which is driving up demand in the market. An increase in population and urbanization will lead to increasing energy demands.
By End User Analysis
- Industrial/commercial segment has dominated the market share due to its cost savings, environmental preservation, and sustainability benefits. Technological advancements and increasing investments in renewable energy are driving the growth of the commercial segment, making it an attractive choice for businesses.
- The residential segment is anticipated to grow significantly as residential buildings adopt rooftop solar PV systems with energy storage systems, driving up demand in the market. The increase in population and urbanization will also lead to increasing energy demands.
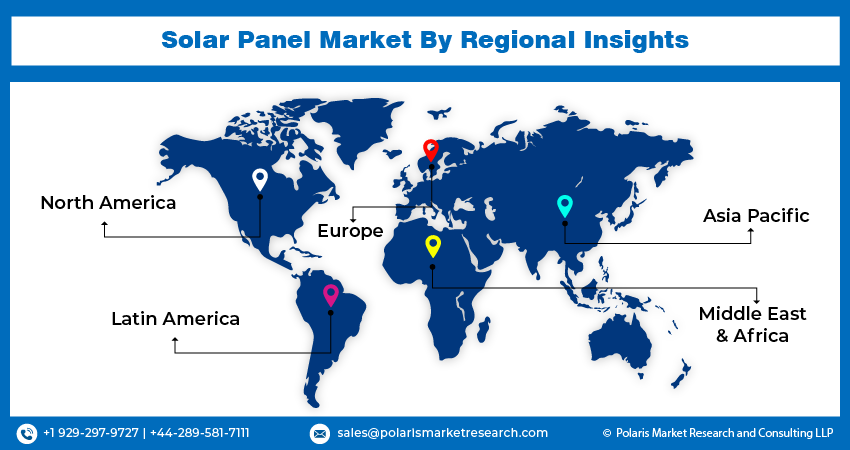
Regional Analysis
- Asia Pacific led the global market and is predicted to continue leading it over the projected time. The expanding use of solar PV modules in numerous utility-scale, residential, and commercial applications, coupled with the surge in infrastructure development and rising investments for the extension of manufacturing capabilities throughout the region, are the main factors contributing to the Asia Pacific solar panels market growth. For instance, in March 2024, China accounted for a major share of global solar panel manufacturing, and the remaining are also located in Asia, including Vietnam, Malaysia, and India. China's manufacturing capacity for solar was more than double the global demand in 2023.
- The market in Europe is anticipated to register the highest rate CAGR during the forecast period. The region’s robust growth is due to the increasing consumer demand for clean energy and rising energy efficiency along with the increased emphasis on reducing greenhouse gas emissions by implementing solar energy as the best alternative to traditional energy sources supplying the region's electricity demands.
Competitive Landscape
Major market players are undertaking different initiatives to enhance their market developments along with strategic collaborations. They are spending a lot on R&D to increase their product lines, which will help the solar panel industry grow even more. Worldwide footprint, including new product launches, contractual agreements, mergers and acquisitions, increased investments, market developments and collaboration with other organizations drives the solar panels market. Upcoming players in the industry must offer cost-effective items to expand and survive in an increasingly competitive and rising market.
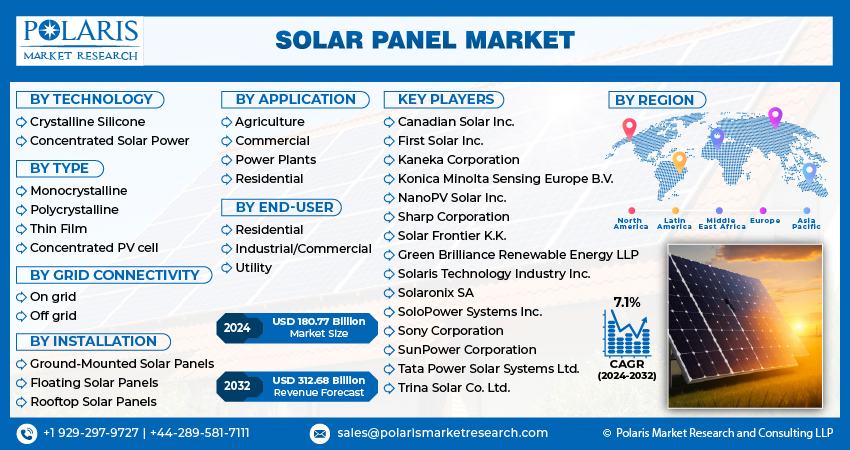
A few of the major players operating in the global market include
- Canadian Solar Inc.
- First Solar Inc.
- Green Brilliance Renewable Energy LLP
- Kaneka Corporation
- Konica Minolta Sensing Europe B.V.
- NanoPV Solar Inc.
- Sharp Corporation
- Solar Frontier K.K.
- Solaris Technology Industry Inc.
- Solaronix SA
- SoloPower Systems Inc.
- Sony Corporation
- SunPower Corporation
- Tata Power Solar Systems Ltd.
- Trina Solar Co. Ltd.
Recent Developments
- In April 2025, Attero partnered with India's National Institute of Solar Energy (NISE) to enhance solar panel recycling. The collaboration includes R&D support, pilot testing of recycling technologies, and exploring a joint research facility to address solar waste management challenges.
- In March 2024, KEREA and GOGLA collaborated to harness the income-generating potential of solar over the next four years, bringing modern, clean energy benefits to a larger portion of the Kenyan population.
- March 2024: India’s Minister of State for New and Renewable Energy said the solar sector drew USD 3.8 billion in FDI over the last three financial years and the current year through September 2023.
- January 2024: Microsoft signed an eight-year agreement with U.S. solar manufacturer Qcells to supply solar panels supporting the addition of 12 gigawatts of solar power to the U.S. electricity grid.
- In February 2024, Tesla, along with a selected partner, is aiming to harness solar energy to light up 1 Cr Indian households by providing 300 units of free electricity.
- In July 2023, India experienced rapid growth and is on the fast track to becoming a significant player in the global solar industry by achieving self-sufficiency in solar modules by 2026.
Report Coverage
The solar panels market report emphasizes on key regions across the globe to provide a better understanding of the product to the users. Also, the report provides market insights into recent developments and trends and analyzes the technologies that are gaining traction around the globe. Furthermore, the report covers an in-depth qualitative analysis pertaining to various paradigm shifts associated with the transformation of these solutions.
The report provides a detailed analysis of the market while focusing on various key aspects such as competitive analysis, technology, type, connectivity grid, installation, application, end-user, and their futuristic growth opportunities.
Solar Panels Market Report Scope
|
Report Attributes |
Details |
|
Market Size Value in 2025 |
USD 210.8 billion |
|
Revenue Forecast in 2034 |
USD 732.7 billion |
|
CAGR |
14.80% from 2025 to 2034 |
|
Base Year |
2024 |
|
Historical Data |
2020–2023 |
|
Forecast Period |
2025–2034 |
|
Quantitative Units |
Revenue in USD billion and CAGR from 2025 to 2034 |
|
Segments Covered |
By Technology, By Type, By Connectivity grid, By Installation, By Application, By End User, By Region |
|
Regional Scope |
North America, Europe, Asia Pacific, Latin America, Middle East & Africa |
|
Customization |
Report customization as per your requirements with respect to countries, region, and segmentation. |
FAQ's
The solar panels market report covers key segments such as technology, type, grid connectivity, installation, application, end user, and region.
The global solar panels market was valued at USD 210.8 billion in 2025 and is expected to reach USD 732.7 billion by 2034 from 2025 to 2034
The solar panels market is expected to exhibit a CAGR of 14.80% during the forecast period
Asia Pacific is leading the global market.
The rising demand for renewable energy sources drives the market growth.
Key players in Solar Panels Market include Canadian Solar Inc., First Solar Inc., Green Brilliance Renewable Energy LLP, Kaneka Corporation, Konica Minolta Sensing Europe B.V., NanoPV Solar Inc., Sharp Corporation, Solar Frontier K.K., Solaris Technology Industry Inc., Solaronix SA, SoloPower Systems Inc., Sony Corporation, SunPower Corporation, Tata Power Solar Systems Ltd., Trina Solar Co. Ltd.
Page last updated on:
Jan-2023
Research Methodology
A robust system of research, verification, and forecasting designed to ensure reliable and actionable market insights.
Polaris Market Research uses a clear and structured approach to deliver insights that clients can rely on. The process combines detailed primary and secondary research, including direct communication with industry experts. The detailed information helps build a complete picture of market trends and developments. Secondary data is gathered from credible sources such as industry reports, company filings, government source links, and trusted organization databases. It is then cross-checked through discussions with key stakeholders across the value chain. Market size and forecasts are developed using both bottom-up and top-down methods to ensure accuracy and consistency in the final results.

1. Project Setup
Step 1 & 2:
- We start every project by clearly understanding the client’s objective or goal, then defining the market scope, and aligning regions, segments, and timelines.
- Once the foundation is set, we collect data from all-around of sources, including company reports, government databases, and paid industry platforms.
- Our research is based on secondary data, which helps us build a strong understanding of the market across regions and industries. Then we validate this information through primary research by speaking directly with industry experts, companies, and stakeholders.
- By combining secondary and primary research, we ensure that our market insights are accurate, practical, and closely aligned with real market conditions.
2. Data Collection
We gather information from both public and verified sources:

3. Data Structuring
Step 3:
- All collected data is organized into a consistent format to ensure accurate analysis. Since inputs come from multiple sources, they are standardized and aligned before use.
- The data is segmented by product, application, and region, and mapped across a defined historical period (2020–2024). All values are converted into common units (USD Mn/Bn), and volume and pricing are aligned where required to estimate revenue.
- Any overlaps or inconsistencies are reviewed and adjusted to maintain accuracy (<5% variance threshold).
- The result is a structured dataset that allows for clear comparison across regions and supports reliable analysis and forecasting.
Structured Market Dataset, USD Mn/Bn

4. Data Structuring
Step 4: TOP-DOWN APPROACH
- We start with the overall market size at a global or macro level.
- The market is then narrowed down based on scope and industry relevance.
- We apply penetration rates and split the data by region and segment.
- This helps us estimate the market size for specific segments.
- The numbers are validated through cross-checks to ensure accuracy.

Step 5: BOTTOM-UP APPROACH
- We begin by analyzing data from leading companies in the market.
- Revenue data is collected and mapped across different segments.
- The data is then aggregated to estimate the total market size.
- To fill in any gaps, adjustments are made based on industry standards.
- Validation checks make sure that the results are correct.

5. Data Structuring
Step 6:
At Polaris Market Research, we employ a methodical forecasting strategy. This approach blends the analysis of historical data with real-time market validation. To forecast future trends with precision, we examine past patterns, pricing fluctuations, and the interplay of supply and demand. To ensure our conclusions reflect the present market landscape, we actively seek input from industry experts and key stakeholders.
To refine our predictions, we carefully consider critical elements such as market drivers and restraints, fluctuations in raw material costs, emerging technologies, and the production capabilities of various regions. Furthermore, we assess regulatory frameworks and potential policy shifts to gauge their potential impact on market expansion.
All this information is synthesized to generate precise forecasts for each segment and region. These forecasts illuminate the current state of the market and highlight forthcoming opportunities.

6. Data Structuring
Step 7:
In the final stage, we validate all our estimates using a triangulation method, where data is cross-checked from multiple reliable sources, like company data, primary interviews, and secondary research. This helps us make sure that our numbers are correct and fit with the rest of the market.
This process involves verifying data consistency across various segments and geographic areas. It also requires comparing historical trends with the assumptions support the forecast. Any discrepancies involve adjustments to ensure everything remains aligned and dependable.
Once the data is finalized, we prepare the final outputs, including market size estimates, segment-wise breakdowns, and growth metrics. These are delivered in structured formats such as tables, charts, and data files for easy analysis and use.
We collaborate closely with clients, ensuring the final products align with their requirements. This includes offering tailored adjustments, supplementary data analyses, and continuous assistance. Furthermore, we monitor market trends post-delivery, providing updates and refinements to maintain the insights' relevance as time passes.
Post-delivery, we continue to monitor market shifts, offering updates and adjustments to ensure the insights remain relevant over time.
Validation
Triangulation Framework
Estimates are cross-verified across three sources:
Company-level data
• Primary inputs from industry participants
• Secondary benchmarks and published data
Variance maintained within +5-10%
Adjustments applied to align estimates
Segment values validated against overall market structure
Quality Check
Data Consistency & Integrity
Segment totals validated to 100%
Regional estimates aligned with global market size
Historical trends compared against forecast outputs
Assumptions reviewed for cross-segment and regional alignment
Output & Delivery
Final Outputs
Market size estimates (USD Mn/Bn)
Segment-wise distribution (%)
Growth metrics (CAGR %)
Final Outputs
Structured tables and charts
Segment-level datasets
Excel-based data files for further analysis
Client Alignment & Support
- Deliverables are aligned with defined client requirements and scope
- Custom data cuts and segment splits are incorporated as required
- Post-delivery queries are addressed through analyst interactions
- Additional clarifications and data support are provided upon request
Client Continuity & Updates
- Market developments are tracked post-delivery to capture changes in key trends
- Updated data and revisions are provided based on new market inputs
- Additional refinements and data cuts are shared as required
- Continued analyst engagement supports evolving client requirements
