
Solvent Recovery and Recycling Market Size, Share, Global Analysis Report, 2026-2034
REPORT DETAILS
Market Statistics
What is the Current Market Size?
Solvent Recovery and Recycling Market size was valued at USD 1.25 billion in 2025. The market is anticipated to grow from USD 1.33 billion in 2026 to USD 2.14 billion by 2034, exhibiting the CAGR of 6.20% during the forecast period.
Market Statistics
- 2025 Market Size: USD 1.25 billion
- 2034 Projected Market Size: USD 2.14 billion
- CAGR (2026-2034): 6.20%
- North America: Largest market in 2025
Industry Trends
Solvent recovery and recycling refer to processes designed to reclaim and reuse solvents in industrial applications. Solvents are substances that can dissolve other materials, and they are commonly used in various industries, such as manufacturing, chemicals, pharmaceuticals, and printing. Solvent recovery and recycling aim to minimize waste, reduce environmental impact, and optimize the use of resources.
Companies in this market provide solutions to recover and recycle solvents from industrial processes, which can include distillation, filtration, and other separation techniques. The recovered solvents can then be reused in the same or similar processes, leading to cost savings and environmental benefits. The market is closely tied to various industries that heavily use solvents, such as pharmaceuticals, chemicals, automotive, electronics, and coatings. These industries are the primary consumers of solvent recovery and recycling solutions.
However, the strategic acquisition of companies not only enlarged the company's overall capacity but also marked the incorporation of two decades of invaluable experience in the field of recycling. The acquisition is expected to enhance its capabilities and knowledge base, positioning it as a more formidable player in the recycling industry. This strategic expansion demonstrates the company's commitment to growth and innovation within the sustainability and recycling landscape.
For instance, In September 2020, With the acquisition of Engov Ltd., CycleSolv LLC increased its capacity and acquired two decades of priceless experience in the recycling sector.
Source: Polaris Market Research Analysis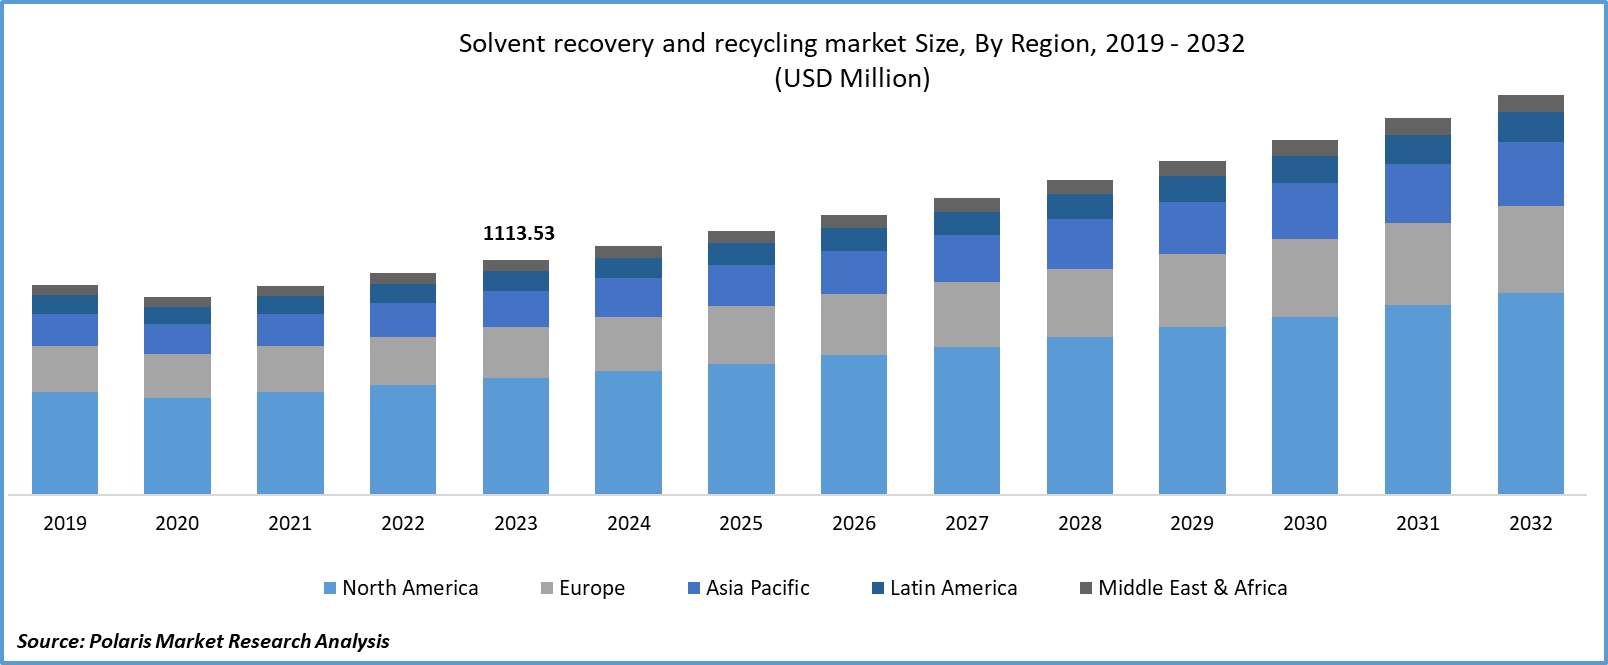
For Specific Research Requirements: Download Sample Report
While the global solvent recycling industry has a history, its widespread adoption has recently gained momentum. The technology aimed at improving the overall efficiency and sustainability of the process is still evolving and is expected to continue advancing in the predictable future.
Solvent Recycling Supplies employs a distillation procedure to remove accumulated hydrocarbons and sand particles from solvents, enabling their recycling into usable forms. The majority of solvents utilized in various processes like metal finishing, electroplating, paint and powder coating, vapor degreasing, and parts washing can be recycled. This practice not only reduces the expenses associated with acquiring new solvents but also alleviates disposal challenges. Hence, the Solvent recovery and recycling market is expected to grow during the forecast period.
Stringent environmental regulations and a growing emphasis on sustainability create opportunities for companies offering solvent recovery and recycling solutions. Businesses aiming to comply with these regulations may seek environmentally friendly practices, contributing to the market's growth. This increases the demand for Solvent recovery and recycling market.
Source: Polaris Market Research Analysis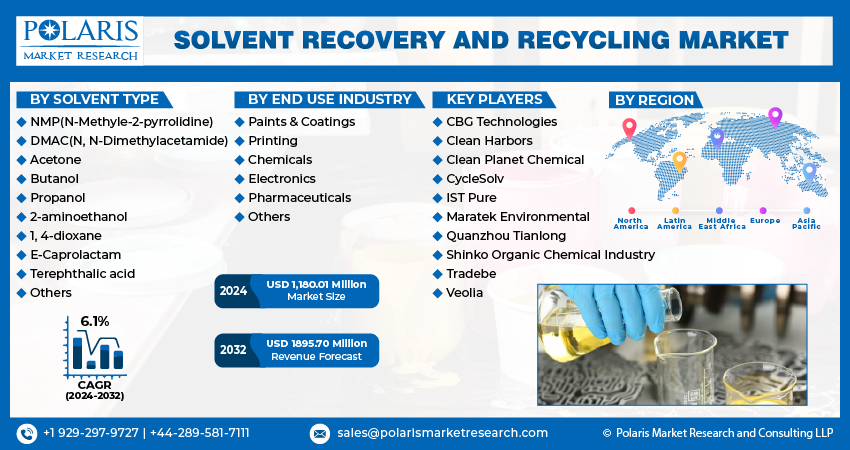
Get Full Segment-Level Forecasts & Insights: Download Sample Report
Key Takeaways
- North America accounted for the largest market in 2025.
- Asia Pacific projected to grow at fastest CAGR during the forecast period
- By solvent type category, DMAC (N, N-Dimethylacetamide) segment held the largest market share in 2025
- By End-use industry category, the painting and coating segment projected to grow at fastest CAGR during them forecast period
What are the Market Drivers Driving the Demand for the Solvent Recovery and Recycling Market?
Industry Expansion and Increased Solvent Usage Is Projected to Spur the Product Demand
Growth in industries such as pharmaceuticals, chemicals, electronics, and automotive, which heavily rely on solvents, contributes to the demand for solvent recovery and recycling. As industrial activities expand, so does the need for sustainable and cost-effective solvent management. Some governments offer incentives, subsidies, or tax benefits to businesses adopting environmentally friendly practices, including solvent recovery and recycling. These incentives encourage companies to invest in such technologies. This resulted in an increasing Solvent recovery and recycling Market during the forecast period.
Global awareness of environmental issues and the importance of sustainable practices has led to increased collaboration between governments, businesses, and environmental organizations. This collaboration promotes the adoption of eco-friendly technologies such as solvent recovery. The development and adoption of green and bio-based solvents contribute to the sustainability of solvent-related processes. These solvents are often more environmentally friendly and can be integrated into solvent recovery systems.
Which Factor is Restraining the Demand for Solvent Recovery and Recycling?
The Availability of Cheap New Solvents
In some cases, businesses may find it more economical to purchase new solvents rather than invest in solvent recovery and recycling systems. The availability of inexpensive virgin solvents may reduce the incentive for adopting recycling practices. Businesses may perceive the return on investment from solvent recovery and recycling systems to be uncertain or too long-term. This perception can discourage investment, especially if short-term financial gains are prioritized. Resistance to change within certain industries may impede the adoption of new technologies. Established practices and traditional methods of solvent disposal may be deeply ingrained, making it difficult to shift to more sustainable alternatives.
Technological Shift to Modular, Automated, and Low-Energy Systems
| Company/Product | Modular Aspects | Automated Features | Low-Energy Elements |
| Koch Modular | Complete modular distillation systems | Process system design for efficiency | Distillation optimization |
| DEC SRU-SMS | Skid-mounted, scalable modules (20k-300k m³/h) | Pre-engineered, pre-tested configurations | Cost-effective scaling reduces ops expenses |
| Sulzer Systems | Flexible single/multi-duty designs | Batch/campaign processing | Streamlined recovery |
| EPIC Systems | Modular distillation tower | Enhanced safety/compliance | Efficiency improvements |
| BMD Pfizer Project | Full modular recovery unit | Rockwell automation integration | - |
| SepPure RE(SOLV) | Heatless equipment | Pressure-driven filtration | No heat, eco-friendly reuse |
Source: Polaris Market Research Analysis
Report Segmentation
The market is primarily segmented based on solvent type, end-use industry, and region.
| By solvent type | By End use industry | By Region |
|
|
|
Source: Polaris Market Research Analysis
To Understand the Scope of this Report: Request Customization
Category Wise Insights
By Solvent type Insights
Based on solvent type analysis, the market is segmented on the basis of NMP (N-Methyle-2-pyrrolidin, DMAC (N, N-Dimethylacetamide), Acetone., Butanol, Propanol, 2-aminoethanol, 1, 4-dioxane, E-Caprolactam, Terephthalic acid, others. DMAC (N, N-Dimethylacetamide) held the largest market share in 2025. DMAC is used as a solvent in the pharmaceutical industry for the synthesis of various drugs and pharmaceutical intermediates. It facilitates the dissolution of a wide range of organic and inorganic compounds. DMAC is employed as a solvent in the production of polymers and resins. It is particularly useful in the dissolution of cellulose-based polymers, such as in the manufacturing of films, fibers, and coatings. DMAC is employed in laboratories as a solvent for various chemical reactions and as a mobile phase in chromatography. Moreover, its high boiling point makes it suitable for certain analytical techniques. DMAC is used in the formulation of paints and coatings as a solvent for resins and pigments. It helps achieve the desired viscosity and consistency in coating applications. DMAC is utilized in the textile industry for the production of synthetic fibers and films. It aids in the spinning of fibers and the dissolution of polymers used in textile applications.
By End Use Industry Insights
Based on end-use industry analysis, the market has been segmented on the basis of Paints & Coatings, Printing, Chemicals, Electronics, Pharmaceuticals, and Others. The painting and coating segment is projected to grow at the fastest CAGR during the forecast period. Growing construction activities, infrastructure projects, and urbanization often drive demand for paints and coatings. Rapid development in these sectors can boost the overall market for painting and coating products. Moreover, the automotive industry is a significant consumer of coatings. If there is an upswing in vehicle production or demand for specialty coatings in the automotive sector, it can contribute to the rapid growth of the painting and coating market. Innovations in coating technologies, such as the development of advanced formulations, environmentally friendly coatings, and smart coatings, can drive market growth. Industries are often inclined to adopt newer and more efficient coating solutions.
Source: Polaris Market Research Analysis
Need Granular Data Across All Market Segments? Request Customization
Regional Insights
North America
North America accounted for the largest share in the solvent recovery and recycling market. This market leadership position can be attributed to several factors contributing to the region's robust presence in the industry. The North American market's prominence may stem from advanced technological capabilities, a well-established industrial infrastructure, and a heightened emphasis on sustainable practices. Additionally, stringent environmental regulations and a growing awareness of the benefits of solvent recovery and recycling have likely driven the adoption of these technologies in the region.
Asia Pacific
The solvent recovery and recycling market is experiencing its most rapid growth in the Asia Pacific region. This surge can be attributed to the dynamic industrial landscape and robust economic growth in Asia Pacific. The rapid industrialization observed, particularly in countries like China and India, has led to increased solvent usage, prompting the need for efficient recovery measures. The heightened emphasis on environmental sustainability and the implementation of stringent regulations have resulted in a significant rise in demand for solvent recovery technologies in the region. Asia Pacific's strategic commitment to eco-friendly practices and the continuous expansion of industrial activities further solidify its position as the primary catalyst for the accelerated growth observed in the solvent recovery and recycling market.
Source: Polaris Market Research Analysis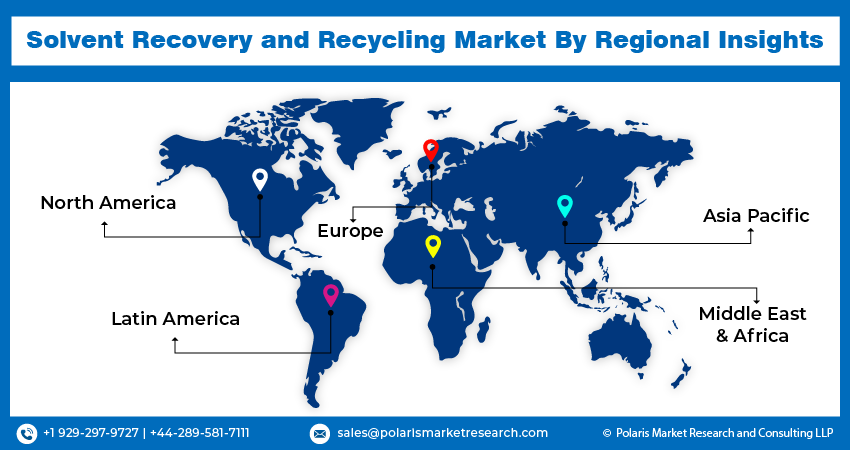
Curious About Regional Market Performance? Request Customization
Competitive Landscape
The solvent recovery and recycling market exhibits fragmentation, with competition stemming from the presence of numerous players. The Leading Market Manufacturers and service providers in this market continuously enhance their technologies to maintain a competitive edge, prioritizing efficiency, integrity, and safety. To achieve a notable market share, these participants emphasize strategic partnerships, ongoing product upgrades, and collaborative efforts, aiming to outpace their industry counterparts.
Some of the major players operating in the global market include:
- CBG Technologies
- Clean Harbors
- Clean Planet Chemical
- CycleSolv
- IST Pure
- Maratek Environmental
- Quanzhou Tianlong
- Shinko Organic Chemical Industry
- Tradebe
- Veolia
Recent Developments
- March 2025: EPA announced 31 major deregulatory actions to advance the administration's energy and economic agenda. The stated aim is to reduce costs, boost domestic industry, and shift regulatory power to states while maintaining the agency's core environmental mission.
- January 2020: Veolia agreed to acquire the hazardous waste treatment site of Alcoa USA Corporation situated in Gum Springs, Arkansas (US). This move marks a significant step for Veolia in the ongoing global expansion of its hazardous waste treatment and recycling endeavors, further solidifying its presence in North America.
- September 2020: CycleSolv LLC strengthened its capabilities by acquiring Engov Ltd, gaining more than two decades of valuable experience in the recycling industry.
Report Coverage
The solvent recovery and recycling market report emphasizes on key regions across the globe to provide better understanding of the product to the users. Also, the report provides market insights into recent developments, trends and analyzes the technologies that are gaining traction around the globe. Furthermore, the report covers in-depth qualitative analysis pertaining to various paradigm shifts associated with the transformation of these solutions.
The report provides detailed analysis of the market while focusing on various key aspects such as competitive analysis, solvent type, end-use industry, and their futuristic growth opportunities.
Solvent Recovery and Recycling Market Report Scope
| Report Attributes | Details |
| Market size value in 2025 | USD 1.25 billion |
| Market size value in 2026 | USD 1.33 billion |
| Revenue forecast in 2034 | USD 2.14 billion |
| CAGR | 6.20% from 2026 – 2034 |
| Base year | 2025 |
| Historical data | 2021 – 2024 |
| Forecast period | 2026 – 2034 |
| Quantitative units | Revenue in USD billion and CAGR from 2026 to 2034 |
| Segments covered | By Solvent Type, By End-Use Industry, By Region |
| Regional scope | North America, Europe, Asia Pacific, Latin America, Middle East & Africa |
| Customization | Report customization as per your requirements with respect to countries, region, and segmentation. |
Source: Polaris Market Research Analysis
Solvent Recovery and Recycling Market FAQ's
The Solvent Recovery and Recycling Market report covering key segments are solvent type, end-use industry, and region.
Solvent Recovery and Recycling Market Size Worth USD 2.14 billion By 2034.
Solvent Recovery and Recycling Market exhibiting the CAGR of 6.20% during the forecast period.
North America is leading the global market
key driving factors in Solvent Recovery and Recycling Market are 1. Environmental Regulations and Sustainability Initiatives
Download Sample Report of Solvent Recovery and Recycling Market
Please fill out the form to request a customized copy of the research report.
