
Space Debris Monitoring and Removal Market Size, Competitive Analysis, 2023-2032
REPORT DETAILS
The global space debris monitoring and removal market was valued at USD 940.69 million in 2022 and is expected to grow at a CAGR of 8.2% during the forecast period.
Space debris includes both naturally occurring meteoroids and artificial (artificial) orbital junk. The majority of manufactured debris is in orbit around the Earth, as opposed to meteoroids, which are in orbit around the Sun. Any artificial object orbiting the Earth that no longer has a functional purpose is considered to be orbital debris. These types of debris include fragmentation debris, mission-related debris, abandoned launch vehicle stages, and malfunctioning spacecraft.
Source: Polaris Market Research Analysis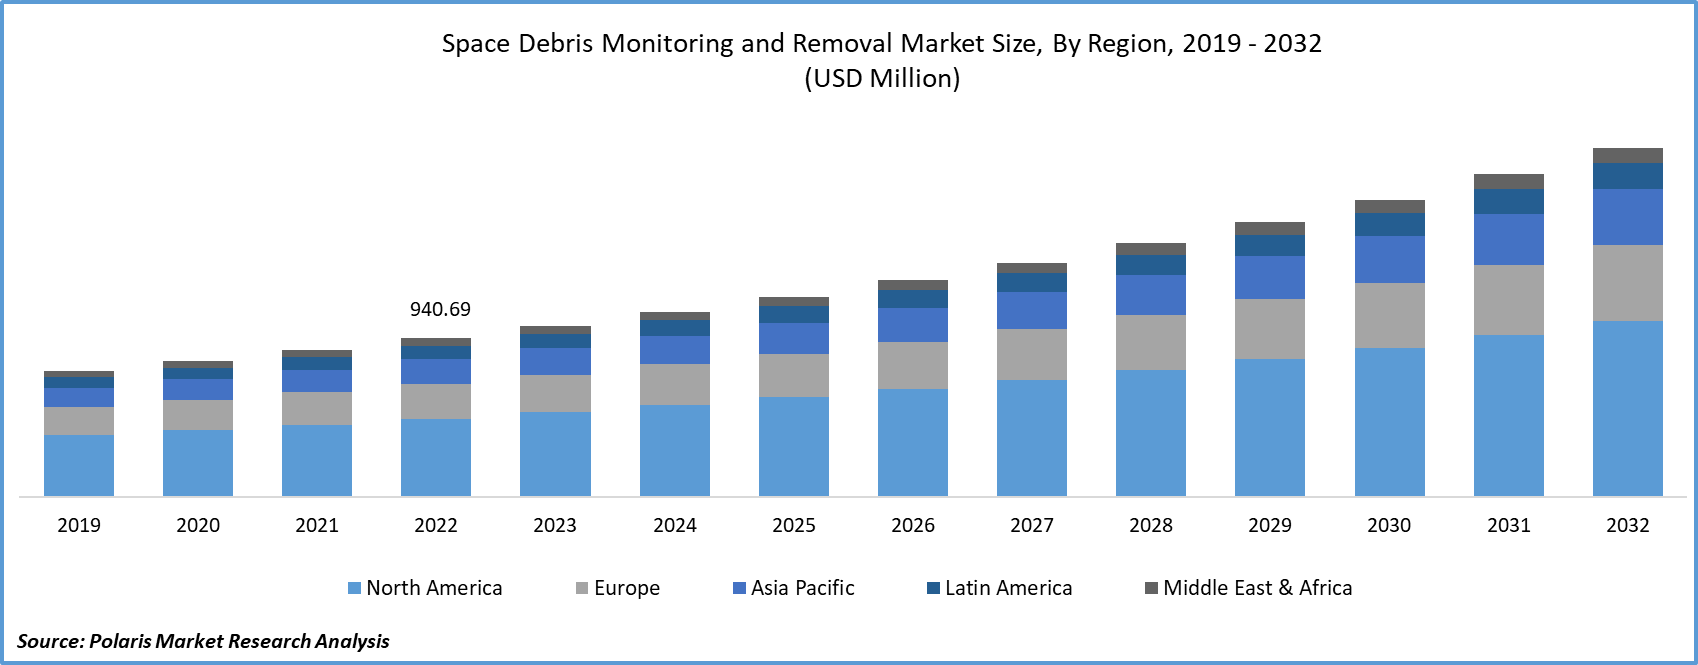
To Understand More About this Research: Download Sample Report
Over 23,000 objects the size of soft-balls are now in orbit around the Earth. Even a small piece of orbital debris can be damaged by them because they are capable of traveling at speeds of around 17,500 mph. There are approximately 500,000 debris fragments the size of a marble and over 100 million debris bits that are 04 inches (or one millimeter) or larger. There is even more debris that has a diameter of 0.000039 of an inch or less.
Space debris is made up of spacecraft that humans no longer operate, but that continue to orbit the Earth. Due to the growth of numerous space organizations and agencies, the companies that monitor and remove space debris have observed a huge demand. The program developed tools to track and remove debris already in space, as well as measures to reduce the amount of orbital debris created.
Additionally, the government regulations for promoting space research as well as controlling the sale of space-related articles is the major factor driving the space debris monitoring and removal market growth over the forecast period. The purpose of the UNOOSA (United Nations Office for Outer Space Affairs) is to encourage international association in the space arena. Still, it is only able to support the COPUOS (Committee for the Peaceful Use of Outer Space) with its administrative needs.
Also, the legal Subcommittee gave the Outer Space Treaty some thought in 1966. It establishes the fundamental framework for international space law, outlining various principles. The exploration and use of space must be done in the best interests of all nations and must belong to all of humanity. Space must also be open to exploration and use by all States. Among other things, the Moon and other heavenly bodies shall only be used for peaceful reasons. As a result, industry regulation has always been a complex patchwork of national laws, with parties periodically adopting "flags of convenience" in pursuit of the country with the best regulatory framework.
Further, the government is working towards the decision-making for debris as they are creating risks to the environment. Global Space Surveillance Network (SSN) sensors operated by the Department of Defence monitor nearly 27,000 bits of the orbital debris. This debris is becoming more prevalent, which raises the risk to all spacecraft, including the International Space Station and other crewed spacecraft like SpaceX's Crew Dragon.
COVID-19 negatively impacted different markets, but they experienced good growth during the pandemic. One of the space debris monitoring and removal markets that have shown improved growth during the epidemic is the space debris monitoring and removal sector. The private market participants have had possibilities throughout this time to invest in R&D and innovation projects. Even the government gave space exploration more consideration. These companies maintained their steady expansion despite the pandemic effect.
Source: Polaris Market Research Analysis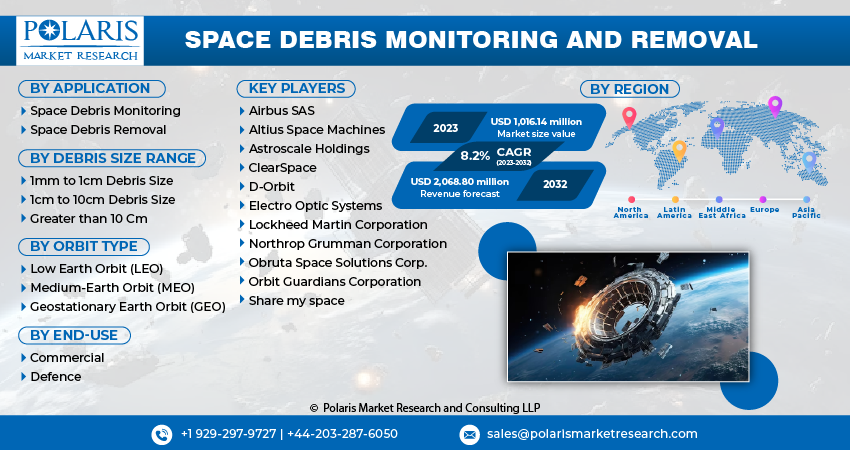
Get Full Segment-Level Forecasts & Insights: Download Sample Report
Industry Dynamics
Growth Drivers
Raising Awareness of Space Solutions
The space debris monitoring and removal market is expanding due to partnerships between major businesses from various nations to raise awareness of space solutions. In December 2022, with the launch of a brand-new initiative to promote space sustainability, the United Nations Office for Outer Space Affairs (UNOOSA) and the Government of the United Kingdom are deepening their collaboration. To execute the Guidelines for the Long-term Sustainability of Outer Space Activities, initiatives will concentrate on increasing awareness and developing capability.
Additionally, the small companies engaged in designing, testing, and tracking debris are assisting the market in advancing its trend. For instance, in August 2022, Astroscale Japan Inc. announced the execution of a marketing cooperation contract with Hulic Co., Ltd., I-NET Corporation, Sangkyo EOS Corporation, and Systems Engineering Consultants Co., Ltd.
Active Debris Removal by Astroscale-Japan, or ADRAS-J, a demonstration satellite for the removal of space debris, is supported and brought to public attention as a result of this relationship, which promotes space sustainability. To offer better space options, these companies are working with the major players. To increase the system's performance, the monitoring capabilities of the debris are improved since these are the factors driving the market growth.
Report Segmentation
The market is primarily segmented based on application, debris size range, orbit type, end-use, and region.
| By Application | By Debris Size Range | By Orbit Type | By End-Use | By Region |
|
|
|
|
|
Source: Polaris Market Research Analysis
To Understand the Scope of this Report: Request Customization
By Orbit Type Analysis
The LEO segment held the fastest market share in 2022
In 2022, the LEO segment held the fastest market share, owing to the major players' focus on the development of satellites. LEO is the most populated of the three. It is where SpaceX, OneWeb, and other large companies are now launching tens of thousands of new satellites as a component of their constellations. It also hosts the International Space Station. LEO, as its name suggests, is the nearest to us and can be found up to 2,000 kilometers from the surface of the Earth. LEO has the greatest debris, which is not surprising. As a result, it frequently serves as the main topic of discussion around the problem.
Furthermore, Satellites on MEO and GEO orbits above LEO are similarly at risk from space debris. It is significant because several major spacecraft are located in these orbits, particularly important GEO-based satellites for communications and MEO navigation systems like the American GPS and the European Galileo. Because the satellite is orbiting the Earth at the same rate that the Earth is revolving, satellites in GEO can keep a fixed location above the planet. Also, de-orbiting a satellite is not a practical option because MEO and GEO are so high in the atmosphere (2,000 km to 36,000 km and 36,000 km, respectively). Instead, retired satellites are being sent to disused orbits known as "graveyard orbits," which adds to the growing amount of space debris in the atmosphere.
By Debris Size Range Analysis
The 1 mm to 1 cm segment held the largest market share in 2022
In 2022, the 1mm to 1cm debris size segment held the largest market share due to a rise in rocket bodies and other small items from satellite launches all over the world. Due to the increased number of space exploration activities, it is anticipated that the 1 cm to 10 cm section of debris will experience significant growth. Nearly 20,000 artificial objects, including 3,372 active satellites, were detected in orbit above the Earth by the U.S. Space Surveillance Network. These are only the items that can be tracked, though. In orbit around the Earth as of January 2019, it was projected that there were more than 128 million bits of debris less than 1 cm (0.4 in), 900,000 portions between 1 and 10 cm, and 34,000 pieces bigger than 10 cm (3.9 in).
Around 90,000 items are thought to be in geosynchronous orbit and low Earth orbit. This trash is obstructing the satellites that orbit the Earth. The removal of this debris will, therefore, accelerate the segment's growth. In the case of segments larger than 10 cm, an increase in LEO orbital space launches could lead to an increase in debris during the following several years. The Market will expand as a result of this.
Regional Insights
North America accounted for the largest market share during the forecast period.
North America accounted for the largest market share during the forecast period owing to the various regulations by the U.S. government for the sale and distribution of space-related materials and the increasing number of space launches in the region. Given its influence within the industry and the International Traffic in Arms Regulations (ITAR), the United States has emerged as the most prominent possible source of regulation. ITAR is a U.S. regulatory framework that regulates the production, sale, distribution, and use of defense and space-related goods. It has made it expensive and challenging, if possible, for U.S. players in the space industry to flag-shop or conduct business in any other way that does not comply with U.S. regulations. As a result, the United States is likely to develop any useful legislation managing space debris.
The European Market has the fastest market share, followed by North America, as a result of important variables such as the use of satellites in military operations, collaborations among major players to remove debris from space, and other space activities. In September 2022, The U.K. Space Agency gave ClearSpace and Astroscale a EUR 4 million grant to design missions to remove currently in-orbit junk while collaborating with a group of business partners. Also, due to factors like the increase in space exploration activities, increased investment in space launches, geographic expansion of major players, and active participation of governmental and nonprofit organizations in the market space, the region is developing.
Key Market Players & Competitive Insights
The key players in the space debris monitoring and removal market continue to evolve as new players emerge and existing ones expand their capabilities. These key players play a pivotal role in shaping the future of space sustainability. They are central to the development of innovative solutions for monitoring and removing space debris, ensuring the safety and longevity of space activities.
Some of the major players operating in the global market include:
- Airbus SAS
- Altius Space Machines
- Astroscale Holdings
- ClearSpace
- D-Orbit
- Electro Optic Systems
- Lockheed Martin Corporation
- Northrop Grumman Corporation
- Obruta Space Solutions Corp.
- Orbit Guardians Corporation
- Share my space
Recent Developments
- March 2025, Astroscale joined forces with India’s Digantara and Bellatrix Aerospace to enhance space debris mitigation and on-orbit servicing capabilities. The partnership aims to provide orbital debris removal solutions to Indian government clients within the next one to two years. This move represents Astroscale’s first operational expansion in the Asia-Pacific region beyond Japan, reinforcing global collaboration in space sustainability.
- March 2025, Bellatrix Aerospace signed an MoU with Astroscale Japan to co-develop propulsion-based solutions for active debris removal and satellite servicing. The collaboration seeks to combine Bellatrix’s green propulsion technology with Astroscale’s expertise in space debris mitigation. It also enables Bellatrix to enter the Japanese market while broadening Astroscale’s presence in India.
- February 2023, With the European Space Agency (ESA), ClearSpace and its industrial partners successfully finished their first significant program review for their ground-breaking operation to remove a massive trash object from Earth orbit. With the achievement of this goal, ClearSpace has proven its capacity to handle the technical demands of this mission.
- September 2022, The UK Space Agency (UKSA) awarded ClearSpace a new contract to head a collaboration developing a debris clearance mission. A feasibility investigation for the Clearing of the LEO Environment with Active Removal (CLEAR) mission, inducted to remove two abandoned objects from the Low-Earth Orbit (LEO).
Space Debris Monitoring and Removal Market Report Scope
| Report Attributes | Details |
| Market size value in 2023 | USD 1,016.14 million |
| Revenue Forecast in 2032 | USD 2,068.80 million |
| CAGR | 8.2% from 2023 - 2032 |
| Base year | 2022 |
| Historical data | 2019 - 2021 |
| Forecast period | 2023 - 2032 |
| Quantitative units | Revenue in USD million and CAGR from 2023 to 2032 |
| Segments Covered | By Application, By Debris Size Range, By Orbit Type, By End-Use, By Region |
| Regional scope | North America, Europe, Asia Pacific, Latin America; Middle East & Africa |
| Customization | Report customization as per your requirements with respect to countries, region and segmentation. |
Source: Polaris Market Research Analysis
Space Debris Monitoring and Removal Market FAQ's
The space debris monitoring and removal market report covering key segments are application, debris size range, orbit type, end-use, and region.
Space Debris Monitoring and Removal Market Size Worth $2,068.80 Million By 2032.
The global space debris monitoring and removal market is expected to grow at a CAGR of 8.2% during the forecast period.
North America is leading the global market.
key driving factors in space debris monitoring and removal market are rising awareness of space solutions.
Download Sample Report of Space Debris Monitoring and Removal Market
Please fill out the form to request a customized copy of the research report.
