

Overview
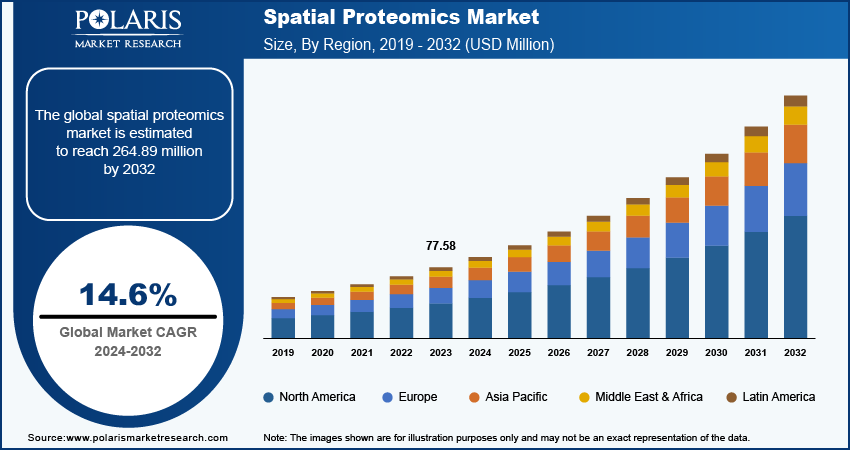
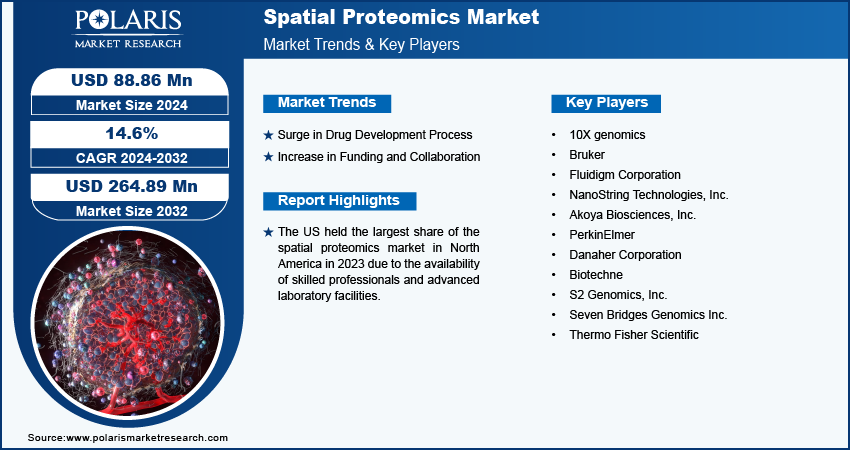
The global spatial proteomics market is estimated around USD 101.42 billion in 2025, with consistent growth anticipated during 2026–2034. Expansion is supported by rising cancer incidence, growing adoption of precision oncology workflows, and increasing integration of spatial biology tools in translational research. The market is projected to grow at a CAGR of 14.6% during the forecast period.
Key Takeaways:
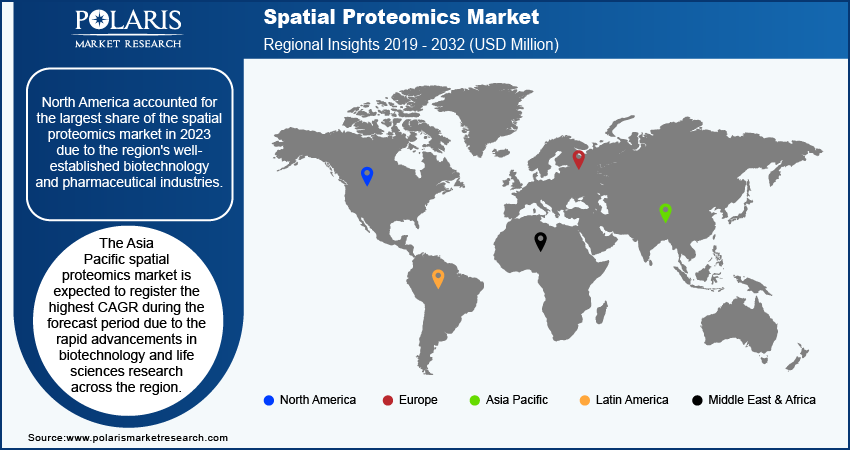
- North America accounted for the largest regional share of around 40.2% in 2025, supported by strong biotech and pharmaceutical presence, increasing precision medicine funding, and continuous innovation in spatial proteomics technologies.
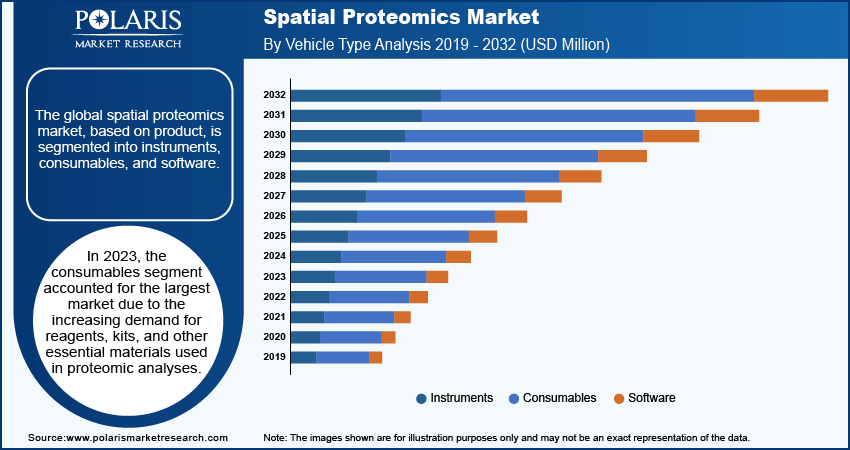
- By Product, Instruments segment accounted for the largest share of approximately 56.8% in 2025, driven by high capital investment, centralized deployment in advanced laboratories, and strong demand for imaging-based proteomics platforms.
- By Workflow, Instrumental Analysis segment accounted for the largest share of around 48.9% in 2025, supported by high-end imaging systems, continuous technology upgrades, and increasing resolution capabilities in research applications.
- By Sample Type, FFPE segment accounted for the largest share of nearly 52.6% in 2025, driven by compatibility with archived clinical tissues, established pathology workflows, and widespread use in retrospective studies.
- By End User, Pharmaceutical and Biotechnology Companies segment accounted for the largest share of around 44.7% in 2025, supported by growing use in biomarker validation, tumor microenvironment analysis, and immuno-oncology research.
- By Application, Oncology segment accounted for the largest share of approximately 61.3% in 2025, driven by rising demand for tumor profiling, immune cell mapping, and therapy response assessment in precision medicine.
Market Statistics
- 2025 Market Size: USD 101.42 billion
- 2034 Projected Market Size: USD 344.52 billion
- CAGR (2026-2034): 14.6%
- North America: Largest market in 2025
Industry Dynamics
- Rising global cancer burden is strengthening demand for tumor microenvironment mapping and biomarker discovery through spatial proteomics platforms.
- Increasing adoption of AI-driven spatial data analysis tools is accelerating throughput and interpretation efficiency.
- High capital expenditure for imaging systems and computational infrastructure creates adoption barriers among mid-tier research institutions.
- Integration of spatial proteomics with transcriptomics and multi-omics workflows is unlocking long-term translational research opportunities.
What are Spatial Proteomics?
Spatial proteomics market is advancing as a distinct, high-value segment within spatial biology market trends, with global spatial proteomics industry revenue expanding alongside precision oncology, immuno-oncology profiling, and translational research funding. The market encompasses instruments such as imaging mass cytometry and multiplex immunofluorescence systems, along with consumables, reagent panels, assay kits, analytical software, and specialized services directly tied to protein-level spatial mapping within intact tissue architecture. It excludes standalone spatial transcriptomics platforms unless incorporated into integrated spatial proteogenomics market workflows, thereby maintaining definitional clarity in spatial proteomics vs spatial transcriptomics comparisons where protein quantification, determines classification.
To Understand More About this Research:Request a Free Sample Report
Drivers & Opportunities
Increasing Demand for Precision Oncology: Rising number of cancer cases is fueling the demand for high-resolution tissue analysis. According to WHO, there were 20 billion new cases of cancer and 9.7 billion cancer deaths in 2022. One in five people develop cancer during their lifetime. This scenario is driving the adoption of spatial proteomics in cancer research for the analysis of the tumor microenvironment and cancer treatment. Biomarker discovery spatial analysis software helps in the analysis of protein expression at a local level, which is useful for targeted therapy.
Integration of AI in Spatial Data Analysis: The rise in the size of the biological dataset is fueling the market for AI in spatial proteomics. In January 2026, Illumina introduced the Billion Cell Atlas, which assists in training an AI model for large biological datasets. This enhances AI-assisted spatial proteomics solutions by improving pattern recognition and predictive models for complex tissue architecture. Highly advanced spatial data analysis software assists in decreasing the analysis time.
Restraints & Challenges
High Capital Expenditure and Data Bottlenecks: High capital cost of spatial proteomics equipment is hampering the growth of the market, as advanced imaging equipment, reagents, and computational infrastructure are highly capital-intensive. Operating costs includes reagent, maintenance, data storage, and bioinformatics personnel. In addition, the standardization of data in spatial biology is also hindering the market growth, as multi-platform data is not analyzed using standardized pipelines. Complex image analysis and protein quantitation pipelines result in analytical bottlenecks.
Opportunity
Multi-Omics Integration and Funding Momentum: The integration of proteomics with transcriptomics is underway for the advancement of spatial proteogenomics technology trends. The implementation of spatial protein and RNA data improves pathway reconstruction and target validation. CRO spatial proteomics services market growth helps the pharma industry in outsourcing integrated analysis. Government and academic funding programs further accelerate adoption, positioning multi-omics integration as a core growth opportunity.
Segmental Insights
This report offers detailed coverage of the spatial proteomics market by product, workflow, sample type, application, and end user to help readers identify the fastest expanding and most attractive demand segments.
By Product
-
Instruments
The spatial proteomics instruments market holds the largest share due to high capital cost and centralized deployment in advanced research labs. Imaging mass cytometry systems, multiplexed fluorescence platforms, and digital spatial profiling instruments account for the majority of revenue.
-
Software & Analytics
The spatial proteomics software market is the fastest-growing segment. Rising complexity of data generated by high-plex experiments accelerates the demand for automated image segmentation and spatial data analysis solutions. Advanced analytics solutions reduce the time required for interpretation and improve the accuracy of biomarker discovery.
By Workflow
-
Instrumental Analysis
Instrumental analysis accounts for the largest market share in the spatial proteomics workflow market. High-end instrumentation and imaging systems generate revenue. Upgrades in technology and increasing resolution further solidify this position.
-
Data Analysis & Interpretation
Spatial data analysis is witnessing a huge demand. Increasing biomarker complexity and AI-assisted interpretation are fueling the growth of the market. Computational workflows now represent a critical differentiator in translational research.
By Sample Type
-
FFPE
The FFPE spatial proteomics led the market due to compatibility with archived clinical samples. Formalin-fixed paraffin-embedded tissues enable retrospective clinical tissue profiling market studies. Established pathology workflows reinforce adoption.
-
Fresh Frozen
Fresh frozen spatial biology adoption is expanding rapidly. Enhanced protein integrity and molecular preservation facilitate high-resolution biomarker mapping. The market is led by translational oncology and early discovery programs.
By End User
-
Pharmaceutical & Biotechnology Companies
Pharmaceutical industry led the market share in 2025. Translational oncology pipelines are increasingly dependent on spatial biomarker validation and tumor microenvironment analysis. Biotechnology companies’ spatial biology platforms integrate spatial information into immuno-oncology development initiatives.
-
CROs & Diagnostic Labs
CRO spatial proteomics market is the fastest-growing end-user industry. The outsourcing trends and the need for specialized spatial knowledge drive the market. The diagnostic labs are embracing spatial assays for precision pathology.
By Application
-
Oncology
Oncology spatial proteomics has the largest market share. Tumor microenvironment analysis, immune infiltration, and therapy response profiling continue to drive demand. Oncology pipelines are the main commercialization engine boosting the growth of the market.
-
Infectious Disease
Infectious disease spatial proteomics is the fastest-growing application. Pathogen-host interaction studies and emerging infectious disease research accelerate demand, particularly in pandemic preparedness programs.
Regional Analysis
North America Spatial Proteomics Market Assessment
North America continued to hold a strong position in the spatial proteomics market, due to the presence of biotech and pharma firms that are allocating resources for high-resolution proteomic analysis. The focus on precision medicine programs also fuels the demand for spatial proteomics analysis, especially in the fields of oncology and immunology. In February 2026, Bruker introduced CellScape-XR, the next-generation spatial proteomics platform intended for advanced cellular protein analysis in research settings. This further indicated the research funding environment in the US, especially in the area of translational proteomics.
Asia Pacific Spatial Proteomics Market Insight
Asia Pacific is projected to growth at a robust pace during the forecast period, driven by the fast expansion of genomics and proteomics initiatives in China, Japan, South Korea, and India. National-scale infrastructure development efforts further fueled the ability to produce and integrate multi-omics data. In August 2025, Chinese government bodies and research organizations such as BGI announced a plan to create a national gene database for the entire country by 2049. The long-term infrastructure development in the genomic industry further fuels the demand for advanced proteomics platforms with spatial resolution capabilities. Government support for life sciences and translational medicine research are further boosting the adoption.
Europe Spatial Proteomics Market Overview
Europe advanced through structured emphasis on precision oncology and translational science within EU research programs. Academic–industry collaborations accelerated commercialization of spatial omics platforms. The NATO Innovation Fund and Earlybird participated in a USD 35 billion Series A round in Portal Biotech, indicating investor interest in high-resolution proteomic innovation. The established academic hospitals and research universities further boosted the integration of spatial technologies to analyze tumor microenvironments and immune interactions, solidifying clinical research adoption.
Middle East Spatial Proteomics Market Assessment
The Middle East market progressed through rising biotechnology infrastructure investments in the UAE and Saudi Arabia. The national strategies for healthcare transformation focused on precision medicine and cutting-edge molecular diagnostics, driving the purchase of high-end proteomics platforms. Research programs supported by the government further fueled the incremental adoption of spatial omics platforms. However, the depth of infrastructure is not as broad as in North America or Europe, continued capital investment in advanced life sciences research has improved regional capability in translational proteomics.
Heat Map Analysis
|
Region |
Market Position |
Growth Momentum |
Regulatory Strength |
Recycling Infrastructure |
Secondary Lead Production Base |
|
North America |
Leading |
High |
High |
Low |
Medium |
|
Asia Pacific |
High |
Very High |
Medium |
Low |
Medium–High |
|
Europe |
High |
Medium–High |
Very High |
Low |
Medium |
|
Middle East |
Emerging |
High |
Medium |
Low |
Low |
Key Players & Competitive Analysis Report
Spatial Proteomics Market demonstrates a moderately consolidated structure, anchored by advanced life sciences instrumentation companies and specialized spatial biology innovators competing on multiplexing depth, imaging resolution, and data analytics integration. The intensity of competition is fueled by technological differentiation in high-plex antibody panels, compatibility with spatial transcriptomics, automated imaging solutions, and bioinformatics infrastructure. Large diversified life sciences companies rely on established reagent platforms, installed instrument bases, and research networks to enhance market positioning.
Major players include 10x Genomics, Inc., Akoya Biosciences, Inc., Bio-Techne Corporation, Bruker Corporation, Danaher Corporation, Ionpath Inc., Lunaphore Technologies SA, NanoString Technologies, Inc., Nikon Instruments Inc., PerkinElmer, Inc., S2 Genomics, Inc., Seven Bridges Genomics Inc., Standard BioTools Inc., Thermo Fisher Scientific Inc., Ultivue, Inc.
Key Players
- 10x Genomics, Inc.
- Akoya Biosciences, Inc.
- Bio-Techne Corporation
- Bruker Corporation
- Danaher Corporation
- Ionpath Inc.
- Lunaphore Technologies SA
- NanoString Technologies, Inc.
- Nikon Instruments Inc.
- PerkinElmer, Inc.
- S2 Genomics, Inc.
- Seven Bridges Genomics Inc.
- Standard BioTools Inc.
- Thermo Fisher Scientific Inc.
- Ultivue, Inc.
Industry Developments
- February 2026: Bruker launched CellScape-XR, an advanced spatial proteomics solution designed to provide high-resolution protein analysis for diagnostic and prognostic purposes. This launch further strengthened the portfolio in Spatial Proteomics by providing more in-depth analysis of proteins in cells and advancing research on complex biological systems.
- September 2023: NanoString launched the most comprehensive spatial proteomics panel, further enhancing the capabilities of analyzing proteins in tissue samples at a high level of multiplexing. The launch solidified the momentum in the Spatial Proteomics business by enabling more detailed protein analysis.
Spatial Proteomics Market Segmentation
By Product Outlook (Revenue, USD Billion, 2021-2034)
- Instruments
- Reagents & Consumables
- Software & Analytics
By Workflow Outlook (Revenue, USD Billion, 2021-2034)
- Sample Preparation
- Instrumental Analysis
- Data Analysis & Interpretation
By Sample Type Outlook (Revenue, USD Billion, 2021-2034)
- FFPE (Formalin-Fixed Paraffin-Embedded)
- Fresh Frozen
By Application Outlook (Revenue, USD Billion, 2021-2034)
- Oncology
- Immunology
- Neuroscience
- Infectious Disease
By End User Outlook (Revenue, USD Billion, 2021-2034)
- Pharmaceutical & Biotechnology Companies
- Academic & Research Institutes
- CROs & Diagnostic Labs
By Regional Outlook (Revenue, USD Billion, 2021-2034)
- North America
- US
- Canada
- Europe
- Germany
- France
- UK
- Italy
- Spain
- Netherlands
- Russia
- Rest of Europe
- Asia Pacific
- China
- Japan
- India
- Malaysia
- South Korea
- Indonesia
- Australia
- Vietnam
- Rest of Asia Pacific
- Middle East & Africa
- Saudi Arabia
- UAE
- Israel
- South Africa
- Rest of Middle East & Africa
- Latin America
- Mexico
- Brazil
- Argentina
- Rest of Latin America
Spatial Proteomics Market Report Scope
|
Report Attributes |
Details |
|
Market Size in 2025 |
USD 101.42 Billion |
|
Market Size in 2026 |
USD 116.02 Billion |
|
Revenue Forecast by 2034 |
USD 344.52 Billion |
|
CAGR |
14.6% from 2026 to 2034 |
|
Base Year |
2025 |
|
Historical Data |
2022–2024 |
|
Forecast Period |
2026–2034 |
|
Quantitative Units |
Revenue in USD Billion and CAGR from 2026 to 2034 |
|
Report Coverage |
Revenue Forecast, Competitive Landscape, Growth Factors, and Industry Trends |
|
Segments Covered |
|
|
Regional Scope |
|
|
Competitive Landscape |
|
|
Report Format |
|
|
Customization |
Report customization as per your requirements with respect to countries, regions, and segmentation. |
FAQ's
• The global market size was valued at USD 101.42 billion in 2025 and is projected to grow to USD 344.52 billion by 2034.
• North America dominated the spatial proteomics market due to strong biopharmaceutical R&D investment, advanced research infrastructure, and high adoption of precision oncology platforms.
• Pharmaceutical and biotechnology companies represent the largest end-user segment, followed by CROs, academic research institutes, and diagnostic laboratories.
• Key companies include 10x Genomics, Inc., Akoya Biosciences, Inc., Bio-Techne Corporation, Bruker Corporation, Danaher Corporation, Ionpath Inc., Lunaphore Technologies SA, NanoString Technologies, Inc., Nikon Instruments Inc., PerkinElmer, Inc., S2 Genomics, Inc., Standard BioTools Inc., Thermo Fisher Scientific Inc., and Ultivue, Inc.
• Growth is fueled by increasing oncology research funding, expansion of immuno-oncology pipelines, rising demand for spatial biomarker validation, and AI-enabled spatial data interpretation advancements.
Page last updated on:
Oct-2024
Research Methodology
A robust system of research, verification, and forecasting designed to ensure reliable and actionable market insights.
Polaris Market Research uses a clear and structured approach to deliver insights that clients can rely on. The process combines detailed primary and secondary research, including direct communication with industry experts. The detailed information helps build a complete picture of market trends and developments. Secondary data is gathered from credible sources such as industry reports, company filings, government source links, and trusted organization databases. It is then cross-checked through discussions with key stakeholders across the value chain. Market size and forecasts are developed using both bottom-up and top-down methods to ensure accuracy and consistency in the final results.

Project Setup
Step 1 & 2:
- We start every project by clearly understanding the client’s objective or goal, then defining the market scope, and aligning regions, segments, and timelines.
- Once the foundation is set, we collect data from all-around of sources, including company reports, government databases, and paid industry platforms.
- Our research is based on secondary data, which helps us build a strong understanding of the market across regions and industries. Then we validate this information through primary research by speaking directly with industry experts, companies, and stakeholders.
- By combining secondary and primary research, we ensure that our market insights are accurate, practical, and closely aligned with real market conditions.
Data Collection
We gather information from both public and verified sources:

Data Structuring
Step 3:
- All collected data is organized into a consistent format to ensure accurate analysis. Since inputs come from multiple sources, they are standardized and aligned before use.
- The data is segmented by product, application, and region, and mapped across a defined historical period (2020–2024). All values are converted into common units (USD Mn/Bn), and volume and pricing are aligned where required to estimate revenue.
- Any overlaps or inconsistencies are reviewed and adjusted to maintain accuracy (<5% variance threshold).
- The result is a structured dataset that allows for clear comparison across regions and supports reliable analysis and forecasting.
Structured Market Dataset, USD Mn/Bn

4. Data Structuring
Step 4: TOP-DOWN APPROACH
- We start with the overall market size at a global or macro level.
- The market is then narrowed down based on scope and industry relevance.
- We apply penetration rates and split the data by region and segment.
- This helps us estimate the market size for specific segments.
- The numbers are validated through cross-checks to ensure accuracy.

Step 5: BOTTOM-UP APPROACH
- We begin by analyzing data from leading companies in the market.
- Revenue data is collected and mapped across different segments.
- The data is then aggregated to estimate the total market size.
- To fill in any gaps, adjustments are made based on industry standards.
- Validation checks make sure that the results are correct.

5. Data Structuring
Step 6:
At Polaris Market Research, we employ a methodical forecasting strategy. This approach blends the analysis of historical data with real-time market validation. To forecast future trends with precision, we examine past patterns, pricing fluctuations, and the interplay of supply and demand. To ensure our conclusions reflect the present market landscape, we actively seek input from industry experts and key stakeholders.
To refine our predictions, we carefully consider critical elements such as market drivers and restraints, fluctuations in raw material costs, emerging technologies, and the production capabilities of various regions. Furthermore, we assess regulatory frameworks and potential policy shifts to gauge their potential impact on market expansion.
All this information is synthesized to generate precise forecasts for each segment and region. These forecasts illuminate the current state of the market and highlight forthcoming opportunities.

6. Data Structuring
Step 7:
In the final stage, we validate all our estimates using a triangulation method, where data is cross-checked from multiple reliable sources, like company data, primary interviews, and secondary research. This helps us make sure that our numbers are correct and fit with the rest of the market.
This process involves verifying data consistency across various segments and geographic areas. It also requires comparing historical trends with the assumptions support the forecast. Any discrepancies involve adjustments to ensure everything remains aligned and dependable.
Once the data is finalized, we prepare the final outputs, including market size estimates, segment-wise breakdowns, and growth metrics. These are delivered in structured formats such as tables, charts, and data files for easy analysis and use.
We collaborate closely with clients, ensuring the final products align with their requirements. This includes offering tailored adjustments, supplementary data analyses, and continuous assistance. Furthermore, we monitor market trends post-delivery, providing updates and refinements to maintain the insights' relevance as time passes.
Post-delivery, we continue to monitor market shifts, offering updates and adjustments to ensure the insights remain relevant over time.
Validation
Triangulation Framework
- Company-level data
- Primary inputs from industry participants
- Secondary benchmarks and published data
- Variance maintained within ±5-10%
- Adjustments applied to align estimates
- Segment values validated against overall market structure
Quality Check
Data Consistency & Integrity
- Segment totals validated to 100%
- Regional estimates aligned with global market size
- Historical trends compared against forecast outputs
- Assumptions reviewed for cross-segment and regional alignment
Output & Delivery
Final Outputs
- Market size estimates (USD Mn/Bn)
- Segment-wise distribution (%)
- Growth metrics (CAGR %)
- Structured tables and charts
- Segment-level datasets
- Excel-based data files for further analysis
Client Alignment & Support
- Deliverables are aligned with defined client requirements and scope
- Custom data cuts and segment splits are incorporated as required
- Post-delivery queries are addressed through analyst interactions
- Additional clarifications and data support are provided upon request
Client Continuity & Updates
- Market developments are tracked post-delivery to capture changes in key trends
- Updated data and revisions are provided based on new market inputs
- Additional refinements and data cuts are shared as required
- Continued analyst engagement supports evolving client requirements
