
Synthetic Natural Gas Market Trends, Industry Analysis, 2025-2034
REPORT DETAILS
Market Statistics
Market Overview
Global synthetic natural gas market size was valued at USD 23.76 billion in 2024. The market is projected to grow from USD 29.28 billion in 2025 to USD 194.53 billion by 2034, exhibiting a CAGR of 23.4% during the forecast period.
The synthetic natural gas market is projected to grow substantially in the coming years due to growing demand for clean energy sources and increased efforts to reduce carbon emissions. The growing emphasis on sustainable energy solutions has led to an increased focus on the use of renewable energy sources, such as biomass, to produce synthetic natural gas. This trend is anticipated to drive significant growth in the market as companies and governments seek to reduce carbon footprints and utilize waste products efficiently.
For instance, in August 2022, Storengy chose MAN Energy Solutions for a methanation reactor to produce synthetic gas (Syngas) at a French wastewater treatment plant. The treatment of sludge by anaerobic digestion produces a mixture of bio-methane and biogenic CO2.
Source: Polaris Market Research Analysis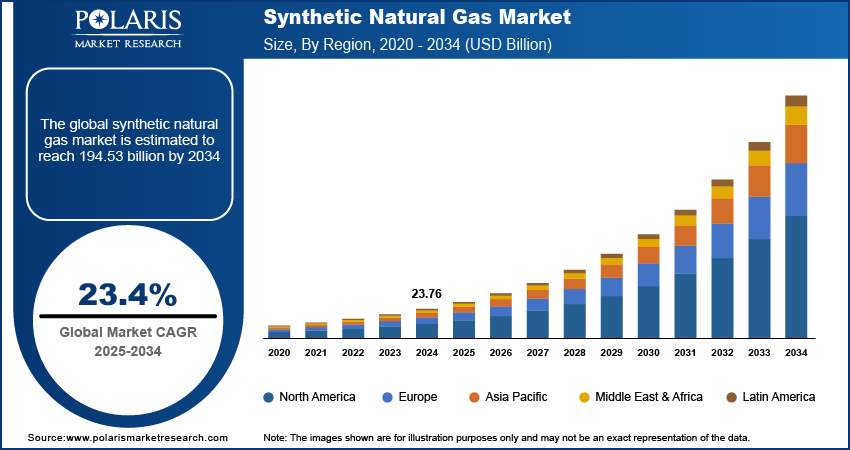
To Understand More About this Research: Download Sample Report
Technological advancements in gas-to-liquid technology are enhancing the production of synthetic natural gas from a diverse range of feedstocks, which is driving growth in the synthetic natural gas market. Additionally, government incentives and regulations promoting the use of cleaner energy sources are significantly contributing to market expansion. For instance, in June 2022, according to the Pipeline and Gas Journal, the Indian government increased the share of natural gas in the country’s energy mix from 6% in 2021 to 15% by 2025. A total of USD 60 billion of new investment is planned in the country’s natural gas infrastructure by 2024.
Market Drivers and Driver Analysis
Government Incentives Promoting Renewable Energy Solutions
Government incentives promoting renewable energy solutions play a pivotal role in driving growth within the synthetic natural gas (SNG) market revenue. These incentives are crucial for encouraging investment in renewable energy technologies that can be harnessed for SNG production. Examples of such incentives include feed-in tariffs (FiTs), which guarantee payments for renewable electricity generation. Investment tax credits (ITCs) that reduce the cost burden for investors, production tax credits (PTCs) that incentivize ongoing renewable energy production; and direct grants and subsidies to support project development and innovation.
For instance, according to the International Renewable Energy Agency (IRENA), government policies and financial incentives have been instrumental in boosting global renewable energy investments. In 2020, renewable energy accounted for a substantial portion of new power capacity in regions such as the European Union, where supportive policies such as feed-in tariffs and investment subsidies facilitated significant renewable energy deployment. These incentives not only make renewable energy projects economically feasible but also promote the adoption of technologies crucial for SNG production from sources including biomass, biogas, and hydrogen. By fostering a favorable investment climate, governments aim to enhance energy security, reduce carbon emissions, and stimulate economic growth through sustainable energy solutions.
Increasing Emphasis on Energy Security
The increasing emphasis on energy security globally has driven the synthetic natural gas (SNG) market revenue, shaping both demand dynamics and strategic investments. Energy security concerns arise from the need to ensure reliable and uninterrupted access to energy sources amidst geopolitical uncertainties, supply disruptions, and environmental challenges associated with fossil fuels.
Governments and energy policymakers are increasingly prioritizing energy security by diversifying energy sources and reducing dependency on imports, thereby bolstering interest in domestic and renewable energy alternatives like SNG. This shift is supported by strategic initiatives aimed at enhancing energy independence and resilience against geopolitical tensions and supply chain vulnerabilities, further boosting the synthetic natural gas market potential.
For instance, according to data from the International Energy Agency (IEA), countries across Europe and Asia Pacific are making efforts to enhance energy security through investments in renewable energy infrastructure and technologies as SNG. These efforts are driven by policies that promote domestic production and the use of renewable resources, reducing reliance on imported natural gas and mitigating risks associated with fluctuating global energy markets.
Source: Polaris Market Research Analysis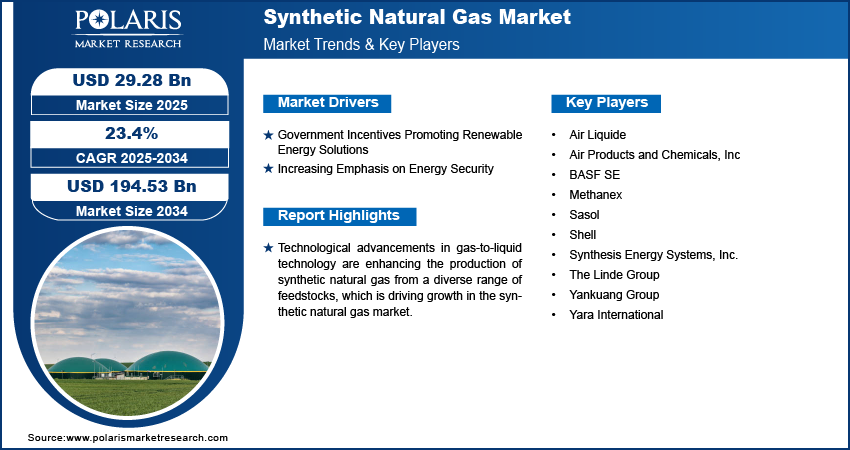
Get Full Segment-Level Forecasts & Insights: Download Sample Report
Segment Analysis
Assessment by Source
The global synthetic natural gas market segmentation, based on source, includes coal, biomass, and renewable energy. The coal segment accounted for a major market share in 2024 due to its relatively inexpensive and easily available source of energy, which makes it a popular choice for producers for the production of synthetic natural gas. Additionally, the advancements in technology have made it more efficient and cost-effective to convert coal into synthetic natural gas, which is another factor enhancing the growth of the synthetic natural gas market outlook.
The renewable energy segment is expected to grow significantly over the forecast period due to the increasing global focus on reducing carbon emissions and sustainability. As key players are striving to meet their climate goals, there has been a significant shift towards renewable sources of energy such as wind, solar, and biomass. This has led to a growing demand for synthetic natural gas produced from these renewable sources boosting the market.
Evaluation by Fuel Technology
The global synthetic natural gas market segmentation, based on technology, includes anaerobic digestion & fermentation, thermal gasification, power to gas, fluidized bed gasifier, and entrained flow gasifier. The thermal gasification segment dominated the market in 2024, owing to its efficiency in the conversion of various feedstocks into high-quality gas. Additionally, the recent advancements in thermal gasification technology made it cost environmentally friendly as well as cost effective option for the production of synthetic natural gas.
For instance, recent innovations have focused on improving the efficiency and environmental performance of gasification processes. This includes advancements in reactor designs, such as fluidized bed gasifiers and entrained flow gasifiers, which enhance the conversion efficiency of feedstocks into synthesis gas (syngas). These technologies operate at higher temperatures and pressures, improving gas quality and reducing emissions of pollutants like particulate matter and tar. Thus, various key players are investing in thermal gasification for their growth driving the synthetic natural gas market revenue.
Source: Polaris Market Research Analysis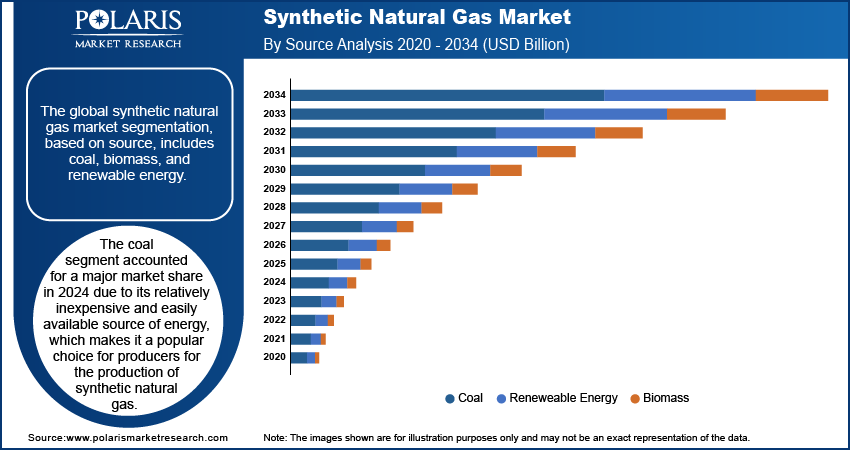
Need Granular Data Across All Market Segments? Request Customization
Regional Insights
By region, the study provides SNG market insights into North America, Europe, Asia Pacific, Latin America, and the Middle East Africa. Asia Pacific's synthetic natural gas market held the largest share in 2024 due to the growing demand for clean energy sources in countries such as India and China. Furthermore, technological advancements in SNG production methods made the process cost-effective and efficient which increased its demand in the market. The abundance of natural gas reserves in countries such as Indonesia and Australia that provide reliable feedstock for synthetic natural gas production is anticipated to boost the regional SNG market growth.
During the forecast period, China synthetic natural gas (SNG) market is poised for substantial growth driven by several key factors. The demand for cleaner energy sources such as SNG is escalating as China seeks to reduce its dependence on coal and mitigate environmental impacts. Government policies promoting cleaner energy, coupled with technological advancements in gasification and methanation processes, are further catalyzing market expansion. Additionally, the integration of renewable energy sources such as biomass and municipal waste into SNG production is enhancing its sustainability profile. These dynamics position China's SNG market on a trajectory of significant growth in the foreseeable future.
Synthetic natural gas (SNG) market in India is poised for significant growth during the forecast period. India's burgeoning energy demand, coupled with initiatives to reduce dependency on imported natural gas and promote cleaner energy sources, are pivotal drivers. Government policies incentivizing the adoption of SNG, alongside advancements in gasification and methanation technologies, further bolster market prospects.
North American synthetic natural gas market is growing significantly over the forecast period, as the region has been able to leverage the advancements in various technologies, such as hydraulic fracturing technology, in order to extract large quantities of gas from shale formations, which led to surplus supply. Additionally, the well-established infrastructure in the region for natural gas distribution and transportation makes for cost-effective and efficient delivery of synthetic natural gas to consumers.
Source: Polaris Market Research Analysis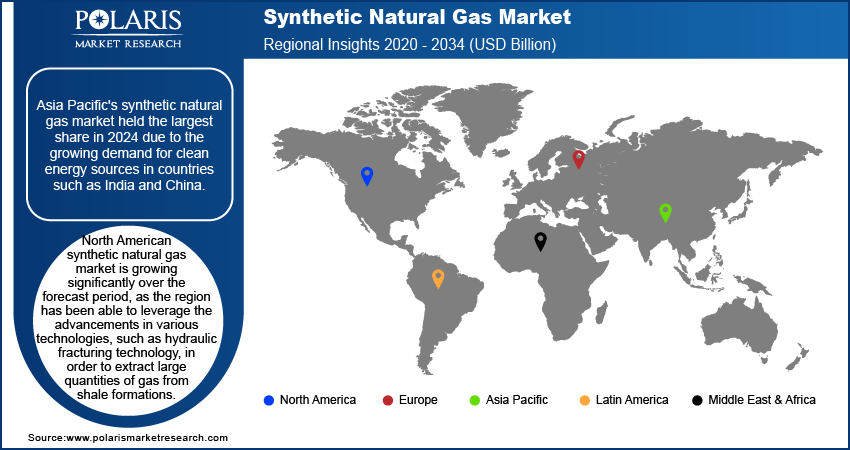
Curious About Regional Market Performance? Request Customization
Key Market Players & Competitive Analysis Report
Major market players are investing heavily in research and development in order to expand their product lines, which will help the synthetic natural gas market grow even more. Market participants are also undertaking a variety of strategic activities to expand their global footprint, with important market developments including new product launches, contractual agreements, mergers and acquisitions, higher investments, and collaboration with other organizations. To expand and survive in a more competitive and rising market climate, the synthetic natural gas industry must offer cost-effective items.
Manufacturing locally to minimize operational costs is one of the key business tactics used by manufacturers in the global synthetic natural gas market to benefit clients and increase the market sector. In recent years, the market has offered some technological advancements. Major players in the synthetic natural gas market, including Air Products and Chemicals, Inc. (U.S); Air Liquide (France); The Linde Group (Germany); Sasol (South Africa); Shell (Netherlands); Synthesis Energy Systems, Inc. (U.S); Yankuang Group (China); Methanex (Canada); Yara International (Norway); and BASF SE (Germany).
BASF SE is a chemical corporation that operates all over the world. It operates through seven segments, including chemicals, industrial solutions, materials, surface technologies, nutrition & care, and agricultural solutions, and others. Petrochemicals and intermediates are provided in the chemicals section. Advanced materials and their precursors for applications such as isocyanates and polyamides are available through the Materials section, as well as inorganic basic products and specialties for the plastic and plastic processing industries. In June 2024, Enerflex and BASF collaborated to deploy carbon capture technology, aiming to reduce greenhouse gas emissions through innovative CCUS solutions.
Air Liquide offers gases-related technologies and services. The company is operating in three business segments that are Gas & Services, Engineering & Construction, and Global Markets & Technologies. Gas & Services provides operation management and performance monitoring services. Engineering & Construction develops industrial gas production plants for plants in the renewable, traditional, and alternative energy sectors. In June 2024, Air Liquide planned an $850M investment for low-carbon oxygen production in Baytown, TX, supporting ExxonMobil's hydrogen project and enhancing its industrial footprint in the US.
List of Key Companies
- Air Liquide
- Air Products and Chemicals, Inc
- BASF SE
- Methanex
- Sasol
- Shell
- Synthesis Energy Systems, Inc.
- The Linde Group
- Yankuang Group
- Yara International
Synthetic Natural Gas Industry Developments
- April 2024: Air Liquide announced plans to further expand its biomethane, or renewable natural gas (RNG), production capacity in the U.S. by constructing two new facilities. Located in Center Township, Pennsylvania, and Holland Township, Michigan, the plants will process biogas sourced from dairy farms.
- March 2024: Electrochaea and Erik Thun AB signed a contract to begin negotiations for the off-take of e-methane from Electrochaea’s subsidiary BioCAT Roslev ApS in Denmark, intended for use as maritime fuel in vessels operated by Erik Thun AB.
- June 2023: Naturgy and Greene collaborated to produce synthetic (syngas) bio-methanation for injection into the distribution network or use in mobility. The innovative aspect of this project, unique in Spain, resides in the type of waste from which the bio-synthetic natural gas is obtained.
- June 2023: TotalEnergies partnered with Tree Energy Solutions for the US synthetic natural gas plant using green hydrogen and biogenic CO2, targeting up to 200,000 metric tonnes annually.
- November 2022: Tokyo Gas, Osaka Gas, Toho Gas, & Mitsubishi Corporation (MC) entered an agreement & conducted a feasibility study on a project to produce synthetic methane in Texas or Louisiana.
Synthetic Natural Gas Market Segmentation
By Source Outlook (Revenue - USD Billion, 2020-2034)
- Coal
- Biomass
- Renewable Energy
By Technology Outlook (Revenue - USD Billion, 2020-2034)
- Anaerobic Digestion & Fermentation
- Thermal Gasification
- Power to Gas
- Fluidized Bed Gasifier
- Entrained Flow Gasifier
By Application Outlook (Revenue - USD Billion, 2020-2034)
- Transportation
- Power Generation
- Industrial
- Grid Injection
By Regional Outlook (Revenue - USD Billion, 2020-2034)
- North America
- US
- Canada
- Europe
- Germany
- France
- UK
- Italy
- Spain
- Netherlands
- Russia
- Rest of Europe
- Asia Pacific
- China
- Japan
- India
- Malaysia
- South Korea
- Indonesia
- Australia
- Vietnam
- Rest of Asia Pacific
- Middle East & Africa
- Saudi Arabia
- UAE
- Israel
- South Africa
- Rest of Middle East & Africa
- Latin America
- Mexico
- Brazil
- Argentina
- Rest of Latin America
Synthetic Natural Gas Report Scope
| Report Attributes | Details |
| Market Size Value in 2024 | USD 23.76 billion |
| Market Size Value in 2025 | USD 29.28 billion |
| Revenue Forecast in 2034 | USD 194.53 billion |
| CAGR | 23.4% from 2025 to 2034 |
| Base Year | 2024 |
| Historical Data | 2020–2023 |
| Forecast Period | 2025–2034 |
| Quantitative Units | Revenue in USD billion and CAGR from 2025 to 2034 |
| Report Coverage | Revenue Forecast, Market Competitive Landscape, Growth Factors, and Industry Trends |
| Segments Covered |
|
| Regional Scope |
|
| Competitive Landscape |
|
| Report Format |
|
| Customization | Report customization as per your requirements with respect to countries, regions, and segmentation. |
Source: Polaris Market Research Analysis
Synthetic Natural Gas Market FAQ's
The global synthetic natural gas market size was valued at USD 23.76 billion in 2024 and is projected to grow at USD 194.53 billion by 2034.
The market exhibits a CAGR of 23.4% during the forecast period, 2025-2034.
Asia Pacific had the largest share in the global market in 2024.
The key players in the market are Air Products and Chemicals, Inc (US); Air Liquide (France); The Linde Group (Germany); Sasol (South Africa); Shell (Netherlands); Synthesis Energy Systems, Inc. (US); Yankuang Group (China); Methanex (Canada); Yara International (Norway); and BASF SE (Germany).
The coal category dominated the market in 2024.
The thermal gasification dominated the market in 2024.
Download Sample Report of Synthetic Natural Gas Market
Please fill out the form to request a customized copy of the research report.
