
Traction Transformers Market Size, Share Analysis Report, 2026-2034
REPORT DETAILS
Market Statistics
What is Traction Transformer Market Size?
The global traction transformer market was valued at USD 1.43 billion in 2025 and is expected to grow at a CAGR of 6.7% during the forecast period. The growth is driven by rise in the investment for rail electrification, expansion of the railway network, and technological advanvcement.
Market Statistics
- 2025 Market Size: USD 1.43 Billion
- 2034 Projected Market Size: USD 2.56 Billion
- CAGR (2026-2034): 6.7%
- Largest Market: Asia Pacific
This growth is attributed to the notable progress in the development of rail infrastructure in numerous countries worldwide, coupled with a rising demand for efficient and faster commuting networks. The promising pace of rail infrastructure development is a key driver for the market. Many countries are investing significantly in expanding and modernizing their rail networks to meet the growing demand for transportation and to enhance overall connectivity. This development encompasses initiatives such as the construction of new rail lines, the electrification of existing ones, and the adoption of advanced technologies in rail systems.
The increasing demand for faster commuting networks is another crucial factor contributing to the market's momentum. As urbanization accelerates and populations grow, there is a heightened need for efficient and rapid transportation solutions. Traction transformers play a vital role in electrified rail systems by facilitating the conversion of electrical power for locomotives, enabling them to operate efficiently and at higher speeds.
Source: Polaris Market Research Analysis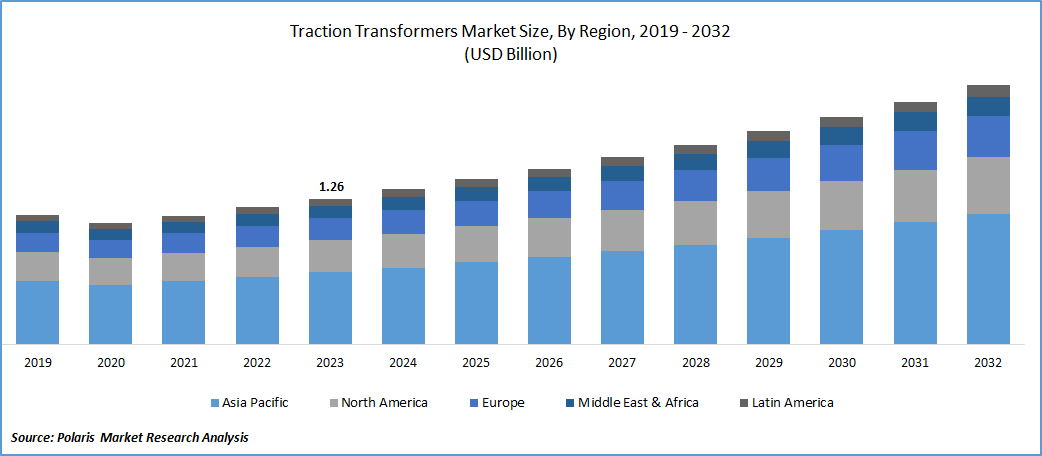
To Understand More About this Research: Download Sample Report
Additionally, favorable government initiatives play a crucial role in driving the implementation of rail equipment, including traction transformers. Governments often introduce policies and allocate funds to support the development of robust public transportation systems. These initiatives align with broader goals such as reducing traffic congestion, promoting sustainable transportation, and improving overall mobility. The integration of advanced equipment like traction transformers, which play a vital role in electrifying and optimizing rail systems, is a key aspect of modernizing railway infrastructure. As a result, the implementation of such equipment strengthens the operational capabilities of railways, making them more efficient, reliable, and capable of meeting the increasing demand for public transportation.
Furthermore, the growing acceptance of rail traction systems in a diverse range of locomotives, including traditional and next-generation models such as diesel & electric locomotives, & tram trains, is anticipated to fuel market growth. This trend is driven by the increasing demand for accommodating a sharp rise in urban passengers and expanding travel routes. Manufacturers design these traction transformers with materials that are non-flammable, capable of withstanding high temperatures, and resistant to vibrations. This design approach is crucial for ensuring optimal performance under diverse working & climatic conditions.
However, the traction transformer market faces challenges due to complex design standards and varying requirements associated with different railway power supply systems. These intricacies can pose constraints on the market's growth as manufacturers need to adapt and customize their products to meet diverse specifications and standards in different regions.
Source: Polaris Market Research Analysis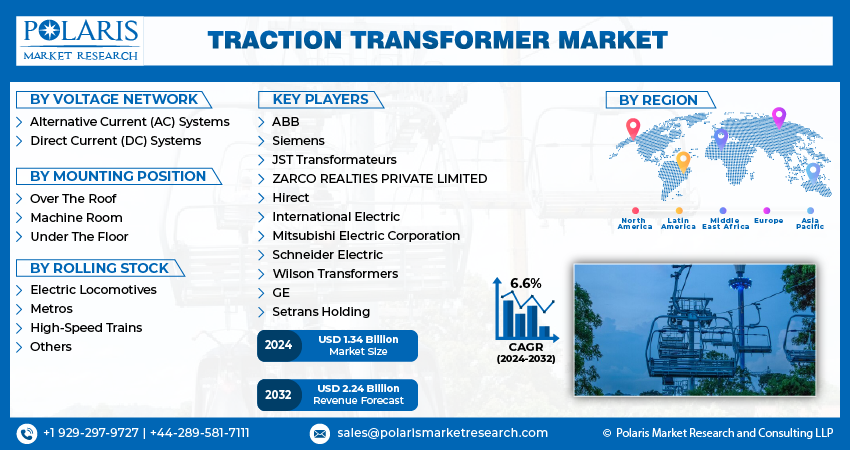
Get Full Segment-Level Forecasts & Insights: Download Sample Report
Industry Dynamics
Growth Drivers
Increased investments in rail electrification projects globally
Increased investments in rail electrification projects globally can drive the demand for traction transformers, as they are essential components for electrified rail transport systems. In the current market landscape, numerous Original Equipment Manufacturers (OEMs) are engaging in public-private partnerships to actively contribute to the development of rail infrastructure across the globe. This collaborative approach involves joint efforts between private sector companies and public entities, such as government agencies or local authorities, to invest in and enhance rail networks. The rationale behind these public-private partnerships is often linked to the mutual benefits derived from combining the expertise and resources of private companies with the regulatory and public interest focus of government entities. Such collaborations facilitate the infusion of advanced technologies, innovation, and efficient management practices into rail infrastructure projects.
Key Trends in Traction Transformers
| Trend | Description | Main drivers | Technical / application notes |
| Shift to lighter onboard transformers | Modern onboard traction transformers are being redesigned for lower weight and higher power density to free space on EMUs and high‑speed trains and reduce energy consumption. | Growth of high‑speed and metro fleets; need to cut train mass to improve acceleration, reduce energy use, and increase passenger capacity. | Power electronic traction transformers (PETT, solid‑state transformers) use medium‑frequency transformers and low‑voltage IGBTs/MOSFETs to shrink volume and weight compared with traditional line‑frequency units. |
| Integration with SiC‑based traction converters | Adoption of SiC devices in traction converters allows higher switching frequencies and lower losses, which in turn enables more compact, optimized traction transformer designs. | Demand for higher efficiency and reduced losses in AC traction systems; pressure to meet energy‑efficiency and CO₂‑reduction targets for rail. | EU rail demos show SiC‑based converters achieving up to 25–30% converter loss reduction and about 20% reduction in transformer losses, with roughly doubled power density versus Si systems. |
| Power electronic traction transformers (PETT/SST) | Market is moving from conventional oil‑cooled line‑frequency transformers toward PETT/solid‑state transformers that combine conversion and isolation, especially for EMUs and metro stock. | Need for multi‑voltage/multi‑system operation (e.g., 15 kV/25 kV AC, DC systems), weight limits on roof‑ or under‑floor mounting, and high efficiency. | PETT topologies integrate rectification, DC/DC conversion and medium‑frequency isolation; optimal sizing methods compare PETT topologies for railway use. |
| Advanced cooling and insulation systems | Use of improved insulation materials and optimized oil/air cooling designs to handle high thermal loads in compact transformers while maintaining reliability. | Thermal stress from higher power density and harsh operating environments (vibration, temperature variation). | Rolling‑stock traction transformers increasingly employ forced‑air or forced‑oil cooling, vibration‑resistant windings and non‑flammable fluids for safety. |
| Digital monitoring and diagnostics | Embedding sensors and condition‑monitoring systems in traction transformers to enable predictive maintenance and reduce unplanned downtime. | Fleet operators seeking higher availability and lower life‑cycle costs through condition‑based maintenance. | Algorithms for running‑status diagnosis of onboard traction transformers use electrical and thermal data to assess insulation ageing and fault risk. |
| Support for rail electrification and green transport | Growing investment in rail electrification projects and urban transit expansion directly increases demand for traction transformers in new and modernized rolling stock and trackside systems. | National programs to electrify mainlines and metros and to shift freight/passenger traffic from road/air to rail as a low‑carbon mode. | AC traction systems with SiC‑based inverters and optimized main transformers deployed on tramways and metros to cut energy use while fitting existing infrastructure. |
Source: Polaris Market Research Analysis
Report Segmentation
The market is primarily segmented based on voltage network, mounting position, rolling stock, and region.
| By Voltage Network | By Mounting Position | By Rolling Stock | By Region |
|
|
|
|
Source: Polaris Market Research Analysis
To Understand the Scope of this Report: Request Customization
By Voltage Network Analysis
AC systems segment accounted for the largest market share in 2025
AC systems segment accounted for the largest share. The rising awareness surrounding the imperative shift to energy-efficient products, aimed at mitigating economic and ecological repercussions associated with outdated technologies, is driving an augmented global demand for AC-type equipment. Additionally, the increasing preference for AC systems in mainline railways is a significant factor contributing to the segment's notable growth.
DC systems segment will grow rapidly. It is primarily due to enhanced voltage stability, the ongoing trend of electrifying railway networks, and the cost efficiency associated with DC systems. DC systems are known for their voltage stability, which is a crucial factor in ensuring a consistent and reliable power supply within railway networks. The stable voltage provided by DC systems contributes to the efficient operation of various components in the railway infrastructure.
Moreover, the global push towards the electrification of railway networks is a significant driver for the growth of the segment. Electrification is seen as an environmentally friendly and sustainable solution, and DC systems play a vital role in supporting this transition. As more railway networks undergo electrification projects to reduce reliance on traditional fuel sources, the demand for DC systems is expected to rise.
By Mounting Position Analysis
Under the floor segment held the significant market share in 2025
Under the floor segment held the significant market share. segment's significance is attributed to the strategic installation of traction transformers beneath the floor of trains, which offers additional space and capacity. As urban populations grow, placing heightened pressure on existing transport infrastructure in economies worldwide, there is a rising demand for equipment that can be seamlessly accommodated under the floor. By locating traction transformers beneath the floor, trains can efficiently utilize the available space without compromising the interior capacity for passengers and cargo. This strategic placement not only optimizes the use of space but also contributes to the overall efficiency and functionality of trains.
Machine room segment is expected to gain substantial growth rate. Growth is attributed to the advantages offered by the equipment installed in the machine rooms, which include maximum reliability & flexibility in the multi-phase rail systems. The increasing adoption of these systems in electric locomotives and high-speed trains is expected to significantly contribute to the segment's growth. Machine room traction systems provide maximum reliability, ensuring consistent and efficient performance in rail systems that operate across multiple phases. The reliability factor is crucial in maintaining the optimal functioning of the entire rail system, contributing to its overall efficiency and safety.
Source: Polaris Market Research Analysis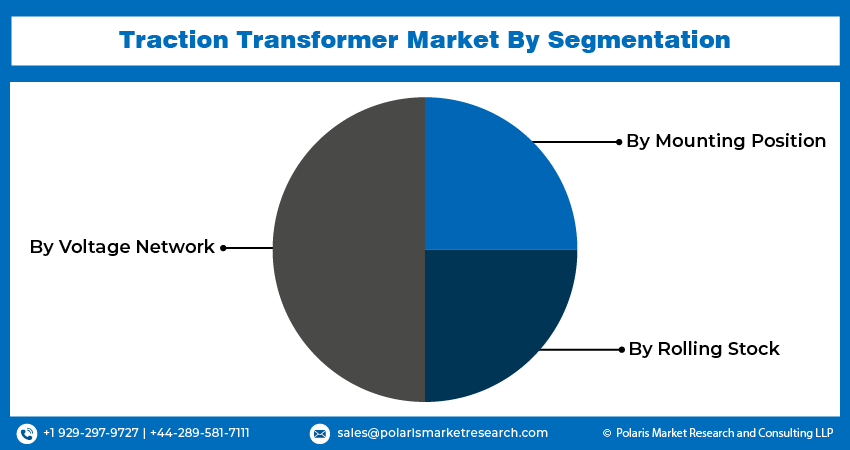
Need Granular Data Across All Market Segments? Request Customization
Regional Insights
Asia pacific dominated the global market in 2025
Growth in the region can be attributed to a combination of increasing government investments and favorable regulations that are specifically geared towards the development of advanced railway infrastructure. The sustained commitment from governments in the region to invest in railway infrastructure is a pivotal factor driving market dominance. These substantial investments are directed at enhancing and expanding railway networks, encompassing projects such as the construction of new rail lines, electrification initiatives, and the adoption of cutting-edge technologies in the rail sector.
Europe will grow with substantial pace. Region is characterized by maturity, marked by the early adoption of various technological advancements evident in rail traction systems. Over the years, both emerging and developed economies in the region have witnessed significant developments in rail infrastructure, including the establishment of high-speed and metro railways. Notably, developed countries in Europe have executed major electric traction programs in recent years.
Source: Polaris Market Research Analysis
Curious About Regional Market Performance? Request Customization
Key Market Players & Competitive Insights
Market participants are employing strategic measures like regional expansion, mergers and acquisitions, partnerships, and collaborations to maintain their market standing. Most incumbents in the market prioritize organic growth as a fundamental strategy.
Some of the major players operating in the global market include:
- ABB
- Siemens
- JST Transformateurs
- ZARCO REALTIES PRIVATE LIMITED
- Hirect
- International Electric
- Mitsubishi Electric Corporation
- Schneider Electric
- Wilson Transformers
- GE
- Setrans Holding
Recent Developments
- In February 2024, Hitachi Energy announced an investment of over USD 33.70 million to upgrade its power transformer facility in Bad Honnef, Germany. The project, set for completion by 2026, aims to support Europe’s clean energy transition and create up to 100 local jobs.
- In October 2024, Hitachi Energy announced a USD 250 million investment over five years to strengthen its India operations. The plan includes expanding large power transformer capacity, upgrading specialty transformer testing, and relocating the bushings factory to support transmission and railway upgrades.
- In April 2023, The BHEL-TWL consortium marked a significant achievement by securing a substantial order for 80 Vande Bharat Trains. BHEL is widely recognized as a leading supplier of rolling stock electrics to the Indian railways.
Traction Transformer Market Report Scope
| Report Attributes | Details |
| Market size in 2025 | USD 1.43 billion |
| Market size in 2026 | USD 1.52 billion |
| Revenue forecast in 2034 | USD 2.56 billion |
| CAGR | 6.7% from 2026 – 2034 |
| Base year | 2025 |
| Historical data | 2021 – 2024 |
| Forecast period | 2026 – 2034 |
| Quantitative units | Revenue in USD million/billion and CAGR from 2026 to 2034 |
| Segments covered | By Voltage Network, By Mounting Position, By Rolling Stock, By Region |
| Regional scope | North America, Europe, Asia Pacific, Latin America; Middle East & Africa |
| Customization | Report customization as per your requirements with respect to countries, region and segmentation. |
Source: Polaris Market Research Analysis
Traction Transformers Market FAQ's
ABB, Siemen, JST Transformateurs, International Electric, Mitsubishi Electric are the key companies in Traction Transformers Market.
The global traction transformer market is expected to grow at a CAGR of 6.7% during the forecast period.
Voltage network, mounting position, rolling stock, and region are the key segments covered.
Increased investments in rail electrification projects globally can drive the demand for traction transformers are the key driving factors in Traction Transformers Market.
The global traction transformer market size is expected to reach USD 2.56 billion by 20324
Download Sample Report of Traction Transformers Market
Please fill out the form to request a customized copy of the research report.
