

What is Unmanned Electronic Warfare Market Size?
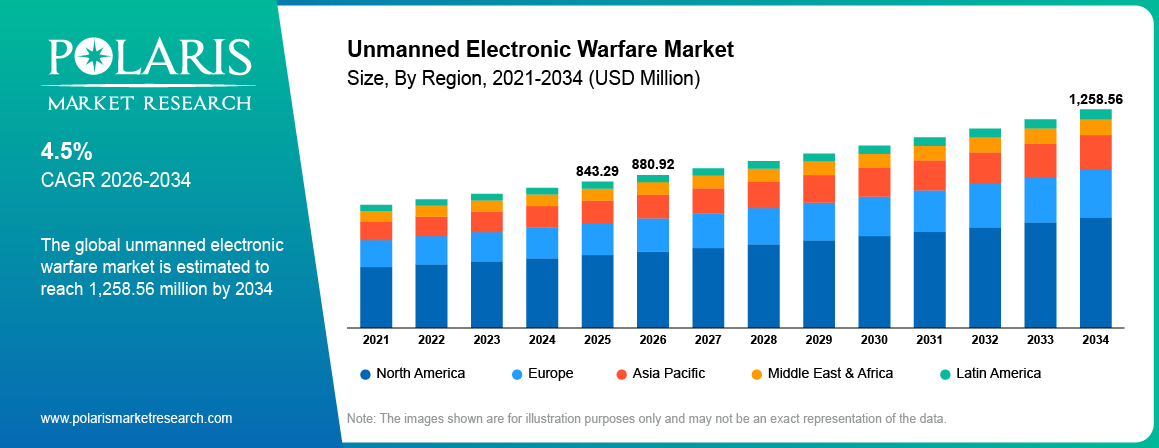
The global unmanned electronic warfare market size was valued at USD 843.29 million in 2025, growing at a CAGR of 4.5% from 2026–2034. Key factors driving the growth is increase in government contracts, and rising demand for low risk and cost-effective warfare.
Key Insights
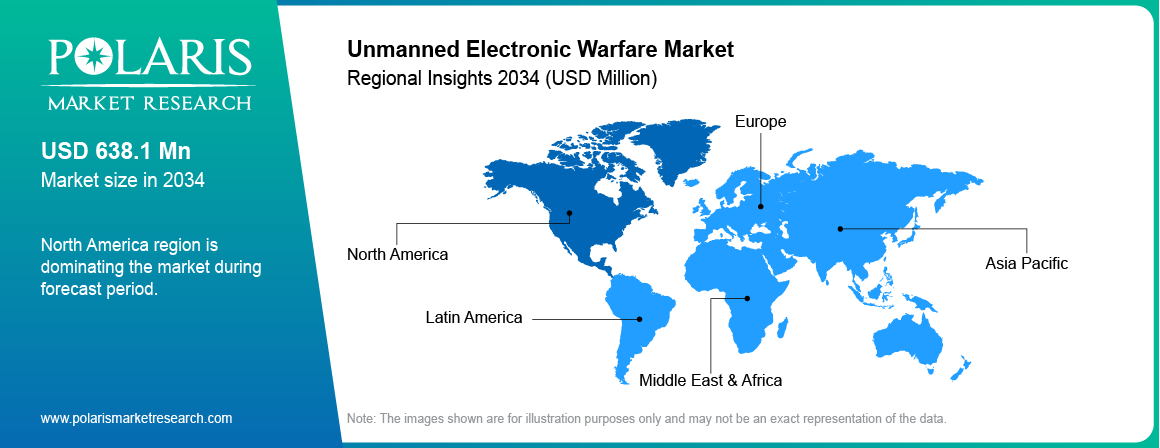
- North America holds the 49.80% share in the unmanned electronic warfare market, mainly driven by strong defense spending and advanced military programs.
- Asia-Pacific is expected to witness the fastest CAGR of 4.9% due to rising geopolitical tensions, especially in the South China Sea.
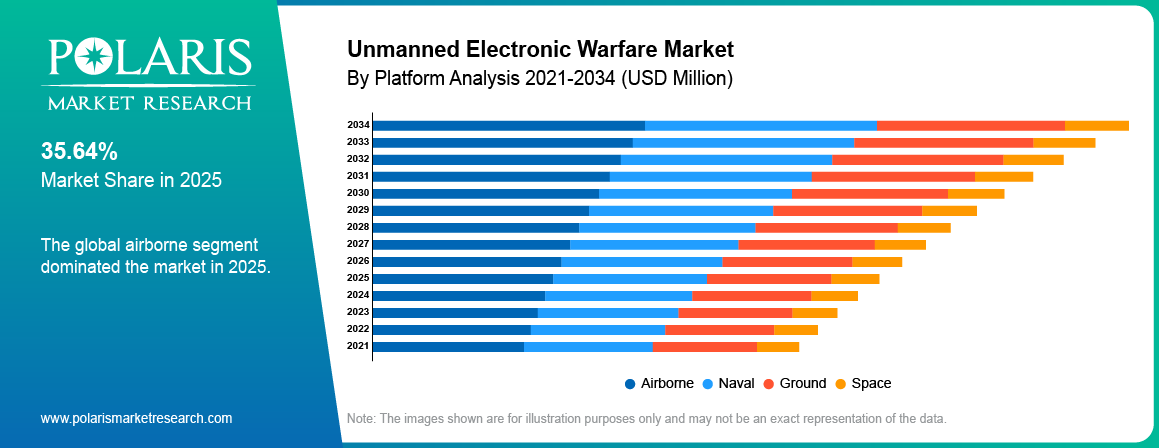
- Based on platform, airborne segment dominated with 35.64% share in 2025 due to its advantages in high altitude operations.
- Based on capabilities, electronic protection segment accounted 23.21% revenue share inn 2025 as it helps safeguard military systems from enemy electronic attacks.
Market Statistics
- 2025 Market Size: USD 843.29 Million
- 2034 Projected Market Size: USD 1,258.56 Million
- CAGR (2026-2034): 4.5%
- North America: Largest Market Share
Industry Dynamics
- The rising government investment in defense is driving the growth.
- Rising demand for low risk and cost-efficient warfare is fueling the growth.
- Technological advancement is boosting the growth.
- High production costs limits the growth of the market.
What Is Unmanned Electronic Warfare?
The electronic warfare uses electromagnetic spectrum for wide range of applications such as detection, monitoring, disruption, or protection of communications, radars, and electronic signals. These systems operate without human intention to support military operations such as surveillance, intelligence gathering, and threat suppression. Electronic warfare integrates in systems such as UAVs, UGVs, USVs, and satellites transforming them from mere platforms into active electromagnetic spectrum nodes. In UAV, it carries EW payload to detect signal and perform operations and in UGVs it deploys jammers and radars to detect communication from ground vehicles. In USVs it monitors maritime activity and disrupt enemy radar systems. In satellite it is used for monitoring, and communication protection form space.
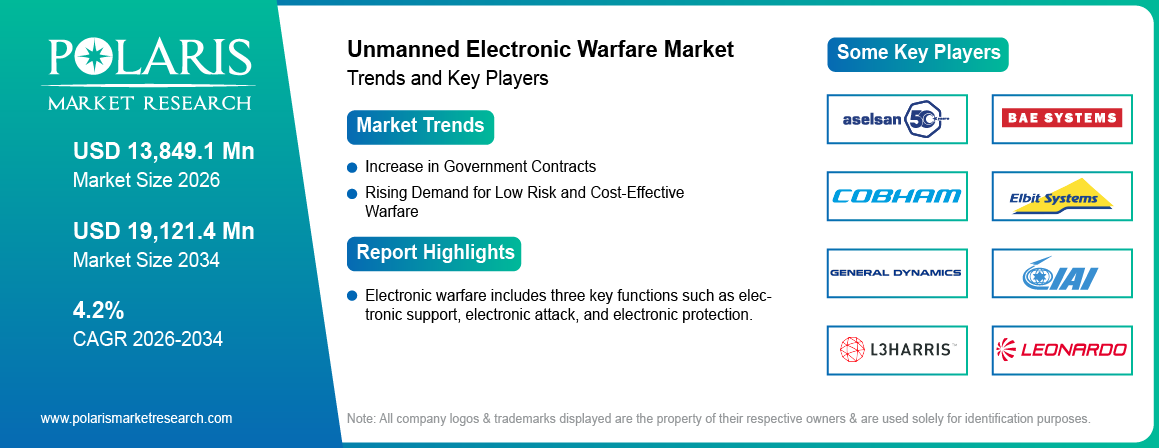
Electronic warfare includes three key functions such as electronic support, electronic attack, and electronic protection. Electronic support involves detecting, intercepting, and analyzing electromagnetic signals to identify potential threats and gather intelligence about enemy communications and radar systems. Electronic attack focuses on disrupting or disabling adversary electronic systems through methods such as jamming, deception, or directed energy. Electronic protection ensures that friendly systems continue to operate effectively by safeguarding them from enemy electronic attacks through techniques such as shielding, signal encryption, and efficient frequency management
Why is UAV-based electronic warfare growing?
The investment in the defense sector in major countries is rising. According to the Atlas Institution of International Affairs, on November 2025, Germany allocated EUR 82.69 billion or USD 94.40 billion for the German Armed Forces. This rise in the investment is supporting the deployment of modern and advance warfare system. This is fueling the demand for the UAV-based electronic warfare. Additionally, rising geological tension and technological advancements are prompting countries to modernize defense equipment’s, which in turn is further fueling the demand for UAV-based electronic warfare, thereby driving the industry growth.
To Understand More About this Research:Request a Free Sample Report
How does geopolitical tension drive EW spending?
Rising geological tensions prompts governments to spend on equipment that are able to protect the modern advance systems. Modern systems heavily rely on communications, radar sensors, and GPS systems that are vulnerable to disruption. This increases the control over electromagnetic spectrum, as a result drives the electronic warfare spending. Moreover, militaries are becoming more dependent on networked systems, this raises the risk of disruption which id further prompting governments to spend on electronic warfare, thereby driving the industry growth.
Drivers & Opportunities
What are Factors Driving Industry Growth?
Increase in Government Contracts: The government contracts to improve the defense capabilities is rising. Defense agencies are allocating the large budgets to strengthen their EW capabilities. Large contracts awarded to companies like Northrop Grumman and Lockheed Martin support the development and deployment of advanced unmanned EW systems. This rise in the defense budgets through government contracts is fueling the demand for the unmanned electronic warfare systems, thereby driving the industry growth.
Rising Demand for Low Risk and Cost-Effective Warfare: The demand for warfare with limited or zero human intervention is rising. This demand is fueled by rising complexity of modern war, and technology backed battlefield. Autonomous and unmanned systems help reduce risks to soldiers by operating in high-threat environments such as areas with heavy surveillance or electronic attacks. This in turn is driving the demand for the unmanned electronic warfare systems. Moreover, unmanned electronic warfare is more affordable compared to manned platforms, as they require less training, maintenance, and operational support which is further increases the demand, thereby driving the industry growth.
Technology Trends in Unmanned Electronic Warfare
|
Trend |
Description |
Key Drivers & Impacts |
Examples |
|
Cognitive EW Systems |
AI-driven adaptive jamming, spectrum management, threat classification. |
Real-time response to dynamic signals; NCW integration. |
AI spectrum analyzers on UAVs. |
|
Multi-Layered C-UAS |
Sensor fusion (RF/radar), kinetic nets, lasers for drone defense. |
Counters RF-silent threats; 576% radar demand surge. |
Tethered drones, drone nets. |
|
Swarm EW Operations |
Coordinated unmanned swarms for distributed jamming/disruption. |
Overwhelms defenses; autonomy reduces manpower. |
Loyal wingman EW pods. |
|
Quantum & Cyber-EW Convergence |
Quantum sensors for secure comms, cyber-EW hybrids on platforms. |
Enhances processing; counters quantum threats. |
Quantum-secured UAV links. |
|
Resilient Navigation/EW |
GPS-alternative PNT, EW-hardened autonomy for denied environments. |
Survivability in jammed spectra. |
Vision-aided inertial nav. |
Segmental Insights
Why Airborne Dominated in 2025?
Airborne segment dominated with 35.64% revenue share in 2025 due to its advantages in high altitude operations. These systems cover large areas, operate at high altitudes, and perform missions without human intervention. This in turn fuels the demand for airborne electronic warfare. Additionally, this are especially useful for surveillance, jamming enemy communications, and gathering intelligence in real time, which further improves the appeal of aerial electronic warfare, thereby driving the segment growth.
Which Segment by Capabilities is Expected to Witness a Significant Share?
Electronic protection segment is expected to witness a significant share over the forecast period as it helps safeguard military systems from enemy electronic attacks. Modern warfare heavily depends on communication, radar, and navigation systems, making them vulnerable to jamming and interference. Electronic protection ensures these systems continue to operate smoothly during attacks. It includes technologies that detect threats, block interference, and maintain signal quality. This growing importance of secure and uninterrupted operations is driving demand for electronic protection solutions across defense forces worldwide, thereby driving the segment growth.
Regional Analysis
What are Regional Statistics of Industry?
North America
North America holds the 49.80% revenue share in the unmanned electronic warfare market, mainly driven by strong defense spending and advanced military programs. The U.S. Department of Defense are awarding large-scale contracts for developing advance electronic warfare systems which is driving the growth in the region. Moreover, the United States Navy actively invests in unmanned airborne platforms to improve surveillance, jamming, and intelligence capabilities. High focus on technological innovation, early adoption of unmanned systems, and continuous modernization of defense infrastructure is driving the market growth in the region.
Asia Pacific
Asia-Pacific is expected to witness the highest growth due to rising geopolitical tensions, especially in the South China Sea. Countries in this region are actively strengthening their defense capabilities with unmanned electronic warfare technologies. Japan is actively developing its electronic warfare units to counter regional threats. Increasing defense budgets, focus on border security, and growing adoption of advanced drone warfare technologies are further driving the growth. Additionally, the need for real-time intelligence and surveillance in conflict-prone areas is further fueling the demand in major countries in this region, thereby driving the growth.
Europe
Europe is experiencing steady growth in the unmanned electronic warfare industry due to rising security concerns linked to tensions between NATO and Russia. Countries in the region are increasing investments in defense modernization and electronic warfare systems to improve their military readiness. Collaborative defense initiatives and joint military programs in European nations are further supporting growth. Additionally, the focus on improving cyber and electronic defense capabilities is boosting the adoption of unmanned systems for surveillance, threat detection, and secure communication operations, thereby driving the growth.
Middle East & Africa
The Middle East & Africa industry is growing due to increasing investments in air defense and military modernization. Countries such as Saudi Arabia and United Arab Emirates are heavily investing in advanced electronic warfare and unmanned systems to strengthen national security. Rising regional conflicts and the need to protect critical infrastructure are driving the demand. Moreover, governments are focusing on upgrading their defense systems with better surveillance and countermeasure capabilities, which is further boosting the adoption of unmanned electronic warfare market in this region.
Latin America
Latin America is an emerging market in unmanned electronic warfare, with gradual adoption of advanced defense technologies. Countries in the region are beginning to recognize the importance of electronic warfare for border security and surveillance. Governments in the region are exploring cost-effective unmanned solutions to improve intelligence and monitoring capabilities. Moreover, partnerships with global defense companies and rising awareness about security threats are expected fuel market development over the forecast period.
Key Players & Competitive Analysis
The unmanned electronic warfare market is highly competitive, with major global defense companies developing advanced drone-based sensing, jamming, and spectrum intelligence systems. Companies such as BAE Systems, Lockheed Martin Corporation, Northrop Grumman Corporation, and Raytheon Technologies Corporation focus on integrated electronic warfare platforms. Firms like Elbit Systems Ltd., Israel Aerospace Industries Ltd., and Aselsan A.S. specialize in advanced electronic intelligence and drone payloads. Meanwhile, L3Harris Technologies, Leonardo S.p.A., Thales Group, SAAB AB, and Textron Inc. focus on autonomous systems and integrated EW capabilities.
Key Players
- Aselsan A.S.
- BAE Systems
- Cobham Plc
- Elbit Systems
- Elbit Systems Ltd.
- General Dynamics Corporation
- Israel Aerospace Industries Ltd. (IAI)
- L3Harris Technologies
- Leonardo S.P.A.
- Lockheed Martin Corporation
- Northrop Grumman Corporation
- Raytheon Technologies Corporation
- SAAB AB
- Textron Inc.
- Thales Group.
Industry Developments
March 2026, L3Harris Technologies and Shield AI demonstrated autonomous electronic warfare integration by combining DiSCO with Hivemind software. The test showed unmanned aircraft detecting, analyzing, and responding to electromagnetic threats in real time and advancing AI-driven multi-domain battlefield operations.
June 2025, Thales Group launched a lightweight electronic warfare payload for small drones at the Paris Air Show. The system enabled frontline units to detect and locate radio signals tens of kilometers away, providing accessible electromagnetic intelligence without requiring specialized training.
Unmanned Electronic Warfare Market Segmentation
By Product Outlook (Revenue, USD Million, 2021–2034)
- Unmanned Electronic Warfare Equipment
- Unmanned Electronic Warfare Operational Support
By Platform Outlook (Revenue, USD Million, 2021–2034)
- Airborne
- Naval
- Ground
- Space
By Capabilities Outlook (Revenue, USD Million, 2021–2034)
- Electronic Support
- Electronic Attack
- Electronic Protection
By Operations Outlook (Revenue, USD Million, 2021–2034)
- Semi-autonomous
- Fully Autonomous
By Regional Outlook (Revenue, USD Million, 2021–2034)
- North America
- US
- Canada
- Europe
- Germany
- France
- UK
- Italy
- Spain
- Netherlands
- Russia
- Rest of Europe
- Asia Pacific
- China
- Japan
- India
- Malaysia
- South Korea
- Indonesia
- Australia
- Vietnam
- Rest of Asia Pacific
- Middle East & Africa
- Saudi Arabia
- UAE
- Israel
- South Africa
- Rest of Middle East & Africa
- Latin America
- Mexico
- Brazil
- Argentina
- Rest of Latin America
Unmanned Electronic Warfare Market Report Scope
|
Report Attributes |
Details |
|
Market Size in 2025 |
USD 843.29 Million |
|
Market Size in 2026 |
USD 880.92 Million |
|
Revenue Forecast by 2034 |
USD 1,258.56 Million |
|
CAGR |
4.5% from 2026 to 2034 |
|
Base Year |
2025 |
|
Historical Data |
2021–2024 |
|
Forecast Period |
2026–2034 |
|
Quantitative Units |
Revenue in USD Million and CAGR from 2026 to 2034 |
|
Report Coverage |
Revenue Forecast, Competitive Landscape, Growth Factors, and Industry Trends |
|
Segments Covered |
|
|
Regional Scope |
|
|
Competitive Landscape |
|
|
Report Format |
|
|
Customization |
Report customization as per your requirements with respect to countries, regions, and segmentation. |
FAQ's
• The global market size was valued at USD 843.29 million in 2025 and is projected to grow to USD 1,258.56 million by 2034.
• The global market is projected to register a CAGR of 4.5% during the forecast period.
• North America dominated the market in 2025
• A few of the key players in the market are Aselsan A.S.; BAE Systems; Cobham Plc; Elbit Systems; Elbit Systems Ltd.; General Dynamics Corporation; Israel Aerospace Industries Ltd. (IAI); L3Harris Technologies; Leonardo S.P.A.; Lockheed Martin Corporation; Northrop Grumman Corporation; Raytheon Technologies Corporation; SAAB AB; Textron Inc.; Thales Group.
• The airborne segment dominated the market revenue share in 2025.
Page last updated on:
Jan-2023
Research Methodology
A robust system of research, verification, and forecasting designed to ensure reliable and actionable market insights.
Polaris Market Research uses a clear and structured approach to deliver insights that clients can rely on. The process combines detailed primary and secondary research, including direct communication with industry experts. The detailed information helps build a complete picture of market trends and developments. Secondary data is gathered from credible sources such as industry reports, company filings, government source links, and trusted organization databases. It is then cross-checked through discussions with key stakeholders across the value chain. Market size and forecasts are developed using both bottom-up and top-down methods to ensure accuracy and consistency in the final results.

Project Setup
Step 1 & 2:
- We start every project by clearly understanding the client’s objective or goal, then defining the market scope, and aligning regions, segments, and timelines.
- Once the foundation is set, we collect data from all-around of sources, including company reports, government databases, and paid industry platforms.
- Our research is based on secondary data, which helps us build a strong understanding of the market across regions and industries. Then we validate this information through primary research by speaking directly with industry experts, companies, and stakeholders.
- By combining secondary and primary research, we ensure that our market insights are accurate, practical, and closely aligned with real market conditions.
Data Collection
We gather information from both public and verified sources:

Data Structuring
Step 3:
- All collected data is organized into a consistent format to ensure accurate analysis. Since inputs come from multiple sources, they are standardized and aligned before use.
- The data is segmented by product, application, and region, and mapped across a defined historical period (2020–2024). All values are converted into common units (USD Mn/Bn), and volume and pricing are aligned where required to estimate revenue.
- Any overlaps or inconsistencies are reviewed and adjusted to maintain accuracy (<5% variance threshold).
- The result is a structured dataset that allows for clear comparison across regions and supports reliable analysis and forecasting.
Structured Market Dataset, USD Mn/Bn

4. Data Structuring
Step 4: TOP-DOWN APPROACH
- We start with the overall market size at a global or macro level.
- The market is then narrowed down based on scope and industry relevance.
- We apply penetration rates and split the data by region and segment.
- This helps us estimate the market size for specific segments.
- The numbers are validated through cross-checks to ensure accuracy.

Step 5: BOTTOM-UP APPROACH
- We begin by analyzing data from leading companies in the market.
- Revenue data is collected and mapped across different segments.
- The data is then aggregated to estimate the total market size.
- To fill in any gaps, adjustments are made based on industry standards.
- Validation checks make sure that the results are correct.

5. Data Structuring
Step 6:
At Polaris Market Research, we employ a methodical forecasting strategy. This approach blends the analysis of historical data with real-time market validation. To forecast future trends with precision, we examine past patterns, pricing fluctuations, and the interplay of supply and demand. To ensure our conclusions reflect the present market landscape, we actively seek input from industry experts and key stakeholders.
To refine our predictions, we carefully consider critical elements such as market drivers and restraints, fluctuations in raw material costs, emerging technologies, and the production capabilities of various regions. Furthermore, we assess regulatory frameworks and potential policy shifts to gauge their potential impact on market expansion.
All this information is synthesized to generate precise forecasts for each segment and region. These forecasts illuminate the current state of the market and highlight forthcoming opportunities.

6. Data Structuring
Step 7:
In the final stage, we validate all our estimates using a triangulation method, where data is cross-checked from multiple reliable sources, like company data, primary interviews, and secondary research. This helps us make sure that our numbers are correct and fit with the rest of the market.
This process involves verifying data consistency across various segments and geographic areas. It also requires comparing historical trends with the assumptions support the forecast. Any discrepancies involve adjustments to ensure everything remains aligned and dependable.
Once the data is finalized, we prepare the final outputs, including market size estimates, segment-wise breakdowns, and growth metrics. These are delivered in structured formats such as tables, charts, and data files for easy analysis and use.
We collaborate closely with clients, ensuring the final products align with their requirements. This includes offering tailored adjustments, supplementary data analyses, and continuous assistance. Furthermore, we monitor market trends post-delivery, providing updates and refinements to maintain the insights' relevance as time passes.
Post-delivery, we continue to monitor market shifts, offering updates and adjustments to ensure the insights remain relevant over time.
Validation
Triangulation Framework
- Company-level data
- Primary inputs from industry participants
- Secondary benchmarks and published data
- Variance maintained within ±5-10%
- Adjustments applied to align estimates
- Segment values validated against overall market structure
Quality Check
Data Consistency & Integrity
- Segment totals validated to 100%
- Regional estimates aligned with global market size
- Historical trends compared against forecast outputs
- Assumptions reviewed for cross-segment and regional alignment
Output & Delivery
Final Outputs
- Market size estimates (USD Mn/Bn)
- Segment-wise distribution (%)
- Growth metrics (CAGR %)
- Structured tables and charts
- Segment-level datasets
- Excel-based data files for further analysis
Client Alignment & Support
- Deliverables are aligned with defined client requirements and scope
- Custom data cuts and segment splits are incorporated as required
- Post-delivery queries are addressed through analyst interactions
- Additional clarifications and data support are provided upon request
Client Continuity & Updates
- Market developments are tracked post-delivery to capture changes in key trends
- Updated data and revisions are provided based on new market inputs
- Additional refinements and data cuts are shared as required
- Continued analyst engagement supports evolving client requirements
