
U.S. Agrochemics Market Size, Growth Drivers, Forecast, 2024-2032
REPORT DETAILS
Market Statistics
U.S. Agrochemicals Market size was valued at USD 34.70 billion in 2023. The market is anticipated to grow from USD 35.73 billion in 2024 to USD 46.07 billion by 2032, exhibiting the CAGR of 3.2% during the forecast period.
Market Overview
Pesticides are chemicals used to control pests, including insects, weeds, fungi, and other harmful organisms that can damage crops. The U.S. agrochemicals market includes a diverse range of pesticides, such as insecticides, herbicides, fungicides, and rodenticides, designed to target specific pests and diseases while minimizing environmental impact.
Source: Polaris Market Research Analysis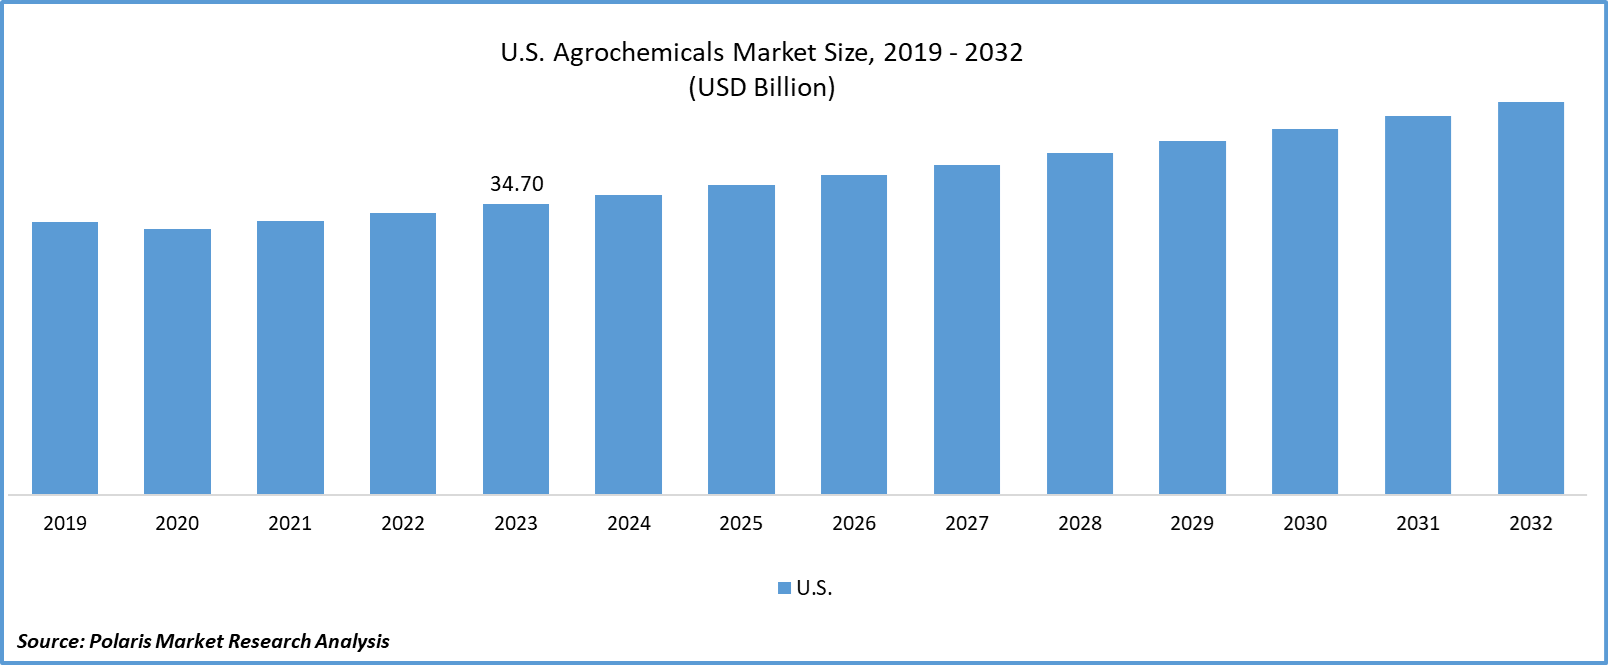
To Understand More About this Research:Download Sample Report
Fertilizers are substances applied to soil or plants to provide essential nutrients that promote plant growth and increase crop yields. The U.S. agrochemicals market includes both synthetic fertilizers, such as nitrogen, phosphorus, and potassium-based fertilizers, and organic fertilizers derived from natural sources like compost, manure, and bio-based materials.
The significant surge in population growth is creating huge concerns about obtaining food security. Traditional farming methods are leading to lower productivity, enabling farmers to shift to alternative ways with a boost in agricultural productivity. One of the major factors driving agrochemicals adoption is the higher growth of population over food production. As per the U.S. Department of Agriculture (USDA) Report 2022, around 12.8% of households in the United States are witnessing food insecurity. As this pertains further, there will be a significant rise in research activities to improve agricultural production, driving new agrochemical innovations in the country.
- For instance, in July 2023, Lucent Bio received approval for its biodegradable smart fertilizer system from the United States. This technology is expected to enable farmers to get a higher return on investment.
Moreover, technological advancements in the agricultural sector are likely to facilitate significant opportunities for agrochemicals in the long run. For instance, in April 2023, Innvictis introduced its latest adjuvant technology, Inntero, to improve the effectiveness of pesticides.
However, growing awareness about organic products and increasing government support for organic farmers are expected to restrict the use of agrochemicals in the United States. The prevalence of huge costs associated with agrochemical development is anticipated to create obstacles to market growth.
Growth Drivers
Rising Concerns about Food Safety
The decreasing number of people engaging in agriculture is expected to propel initiatives to drive food production in the United States. This emphasizes governments to formulate effective policies to incentivize people to enter agriculture and increase earning potential. There will be a reasonable demand for pesticides and fertilizers in the country, driven by their ability to boost yield and the growing development of hybrid and genetically modified seeds, which may necessitate agrochemical use during the forecast period.
Increasing Collaborations in Agrochemical Development
The rise in research activities towards agrochemicals, followed by such product launches in the U.S., is creating new growth prospects. Researchers are concerned about sustainable green fertilizers having positive outcomes without any undesirable impact on landmass or future generations. In line with this, PepsiCo and Fertiberia collaborated to introduce environment environment-friendly fertilizer program with the aim of reducing carbon emissions from potato farming via replacing green hydrogen instead of natural gas. Moreover, the rising production of agrochemicals worldwide is expected to drive agrochemical market expansion in the United States.
Restraining Factors
Government Policies to Promote Sustainable Farming
Government and non-government organizations are increasing efforts to combat environmental pollution. This is expected to hamper the demand for agrochemicals in the long run.
According to the UN Environment Programme, around 12 billion kilograms of plastics and 4 billion tons of pesticides are anticipated to be produced in agricultural farms annually. At the same time, approximately 11000 people died due to adverse pesticide effects.
Additionally, increasing investments is likely to restrain agrochemical utility around the world, including the United States. For instance, in March 2023, Kenya, Philippines, Vietnam, Uruguay, Laos, and Ecuador announced an investment of USD 379 million to reduce agricultural pollution caused by pesticides and plastic.
Source: Polaris Market Research Analysis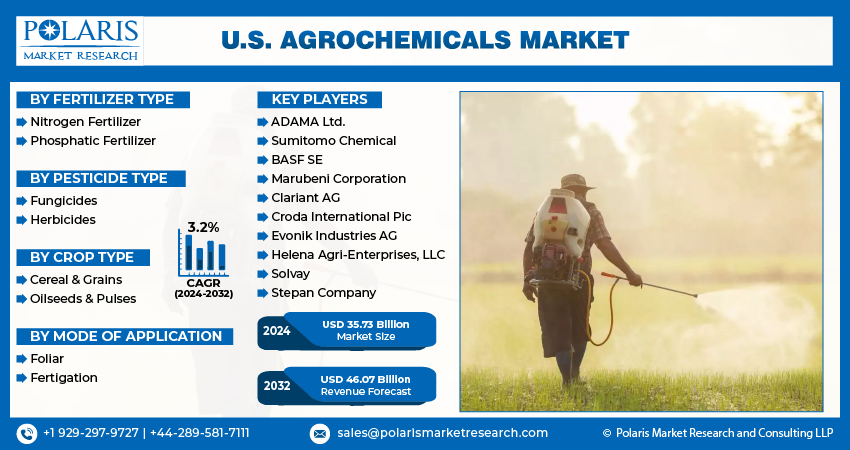
Get Full Segment-Level Forecasts & Insights: Download Sample Report
Report Segmentation
The market is primarily segmented based on fertilizer type, pesticides type, crop type,and mode of application.
| By Fertilizer Type | By Pesticide Type | By Crop Type | By Mode of Application |
|
|
|
|
Source: Polaris Market Research Analysis
To Understand the Scope of this Report:Request Customization
By Fertilizer Analysis
Nitrogen Fertilizer Segment is Expected to Witness the Highest Growth During the Forecast Period
The nitrogen fertilizer segment is projected to grow at a CAGR during the projected period, mainly driven by its role in improving reproduction and driving plant growth. This nitrogen fertilizer passes nutrients to the plants more quickly, supporting plant productivity and growth. Furthermore, the growing demand for emission-free fertilizers is likely to bolster nitrogen fertilizer adoption.
The phosphatic fertilizer segment led the market with a substantial revenue share in 2023, largely attributable to its ability to strengthen the root, flower, and seed development process in plants. It plays a vital role in safeguarding plants from extreme weather conditions. Additionally, the rising innovations in phosphatic fertilizer development are unraveling the true potential of these fertilizers in the marketplace.
By Pesticides Type Analysis
The Herbicides Segment Accounted for the Largest Market share in 2023
The herbicides segment accounted for the largest market share in 2023 and is likely to retain its market position throughout the forecast period. The increasing growth of weeds in crop farming, primarily in soybeans and corn, is driving the expansion of the agrochemicals market in the United States. Based on the USDA Data, 94% of soybeans and 90% of corn are registering the prevalence of herbicides.
Source: Polaris Market Research Analysis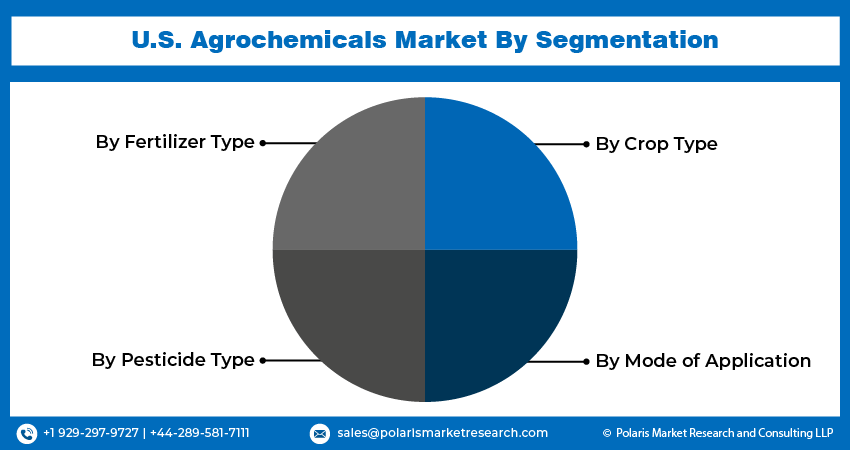
Need Granular Data Across All Market Segments? Request Customization
Key Market Players & Competitive Insights
The U.S. agrochemicals market is registering moderate to high competition with the growing emphasis on new product developments by the major companies. The increasing investments in product innovations, and research activities are widening the agrochemical market expansion.
Some of the major players operating in the U.S. market include:
- ADAMA Ltd.
- Sumitomo Chemical
- BASF SE
- Marubeni Corporation
- Clariant AG
- Croda International Pic
- Evonik Industries AG
- Helena Agri-Enterprises, LLC
- Solvay
- Stepan Company
Recent Developments in the Industry
- In August 2023, BASF Agricultural Solutions introduced Liberty ULTRA herbicide in the United States. This is developed by using Glu-L technology, and works in eradicating grasses, specifically palmer amaranth, kochia and more in corn, soybeans, cotton, and canola.
Report Coverage
The U.S. agrochemicals market report emphasizes on key country across the globe to provide better understanding of the product to the users. Also, the report provides market insights into recent developments, trends and analyzes the technologies that are gaining traction around the globe. Furthermore, the report covers in-depth qualitative analysis pertaining to various paradigm shifts associated with the transformation of these solutions.
The report provides detailed analysis of the market while focusing on various key aspects such as competitive analysis, fertilizer type, pesticide type, crop type, mode of application, and their futuristic growth opportunities.
U.S. Agrochemicals Market Report Scope
| Report Attributes | Details |
| Market size value in 2024 | USD 35.73 billion |
| Revenue forecast in 2032 | USD 46.07 billion |
| CAGR | 3.2% from 2024 – 2032 |
| Base year | 2023 |
| Historical data | 2019 – 2022 |
| Forecast period | 2024 – 2032 |
| Quantitative units | Revenue in USD million and CAGR from 2024 to 2032 |
| Segments covered |
|
| Competitive Landscape |
|
| Report Format |
|
| Customization | Report customization as per your requirements with respect to countries, and segmentation. |
Source: Polaris Market Research Analysis
Us Agrochemics Market FAQ's
U.S. Agrochemicals Market Size Worth $ 46.07 Billion By 2032
The top market players in U.S. Agrochemicals Market are ADAMA Ltd., Sumitomo Chemical, BASF SE, Marubeni Corporation, Clariant AG
U.S. Agrochemicals Market exhibiting the CAGR of 3.2% during the forecast period.
U.S. Agrochemicals Market report covering key segments are fertilizer type, pesticides type, crop type,and mode of application.
Download Sample Report of U.S. Agrochemics Market Size, Growth Drivers, Forecast, 2024-2032
Please fill out the form to request a customized copy of the research report.
