
U.S. Biostimulants Market Growth Opportunity, Report, 2025-2034
REPORT DETAILS
Market Statistics
Market Overview
The U.S. biostimulants market size was valued at USD 532.38 million in 2024, and is anticipated to register a CAGR of 6.8% from 2025 to 2034. The market growth is mainly driven by the growing demand for sustainable farming practices, as farmers seek ways to improve crop yields while avoiding the adverse impact on the environment.
Key Insights
- By active ingredient, the acid-based segment, primarily humic, amino acids, and fulvic acids, held the largest share in the U.S. market in 2024.
- By crop type, the row crops and cereals segment held the largest share in 2024, mainly because of the vast areas dedicated to growing crops such as corn, wheat, and soybeans across the country. The significant acreage means that even small improvements in yield or plant health from biostimulants translate into considerable overall demand for these products.
- By application, the foliar treatment segment held the largest share in 2024. This involves spraying biostimulant solutions directly onto plant leaves, allowing for quick absorption and visible benefits to plant health and nutrient use efficiency.
Source: Polaris Market Research Analysis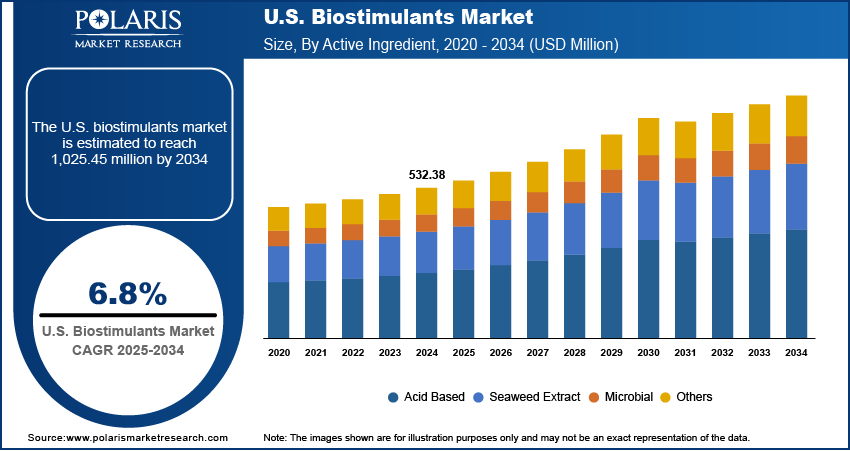
Want a Deeper Look at Key Market Players? Download Sample Report
The U.S. biostimulants market involves products that naturally help plants grow better. They are applied to plants, seeds, or the soil around plant roots. These products improve how plants take in nutrients, how well they use those nutrients, and their ability to handle tough environmental conditions such as drought or extreme temperatures, all without acting as fertilizers or pesticides.
The increasing frequency and intensity of unfavorable environmental conditions, known as abiotic stresses, are significantly driving the demand for biostimulants. These stresses include phenomena such as drought, extreme temperatures (both heat and cold), salinity in soil, and flooding. Such conditions severely impact crop growth, development, and overall yield potential, leading to substantial agricultural losses. Farmers are increasingly seeking ways to make their crops more resilient to these unpredictable and harsh environmental factors. Biostimulants offer a natural approach to boost a plant's inherent defense mechanisms and its ability to cope with such challenges without relying on genetic modification or heavy chemical inputs.
Ongoing innovations in the development and application of biostimulants are driving the U.S. biostimulants market. Researchers and companies are continually working to identify new and more effective active ingredients, improve formulation stability, and refine application methods to maximize the benefits of these products. This includes exploring novel sources of beneficial compounds, understanding the complex interactions between biostimulants and plant physiology, and developing more targeted solutions for specific crop needs or environmental challenges.
Industry Dynamics
- The adoption of sustainable agricultural practices is increasing across the U.S., contributing significantly to the growing demand for biostimulants.
- There is a rising consumer preference for organic and naturally grown produce, which is prompting farmers to incorporate biostimulants into their crop production methods.
- The need to improve crop resilience against abiotic stress factors such as drought, salinity, and extreme temperatures is encouraging the use of biostimulants.
- Ongoing advancements in biostimulant product development and application techniques are supporting market growth by improving product efficacy and ease of use.
Increased Adoption of Sustainable Agricultural Practices: The shift toward sustainable agriculture is a significant driver for the biostimulants market in the U.S. Farmers are increasingly seeking methods that reduce environmental impact while maintaining or improving crop productivity. Biostimulants offer a way to achieve this by improving soil health, optimizing nutrient uptake, and reducing the reliance on synthetic chemicals.
The USDA's National Institute of Food and Agriculture (NIFA) outlines that sustainable agriculture aims to increase profitable farm income, promote environmental stewardship, and enhance the quality of life for farm families and communities. This emphasis on environmental stewardship and resource conservation directly encourages the use of products such as biostimulants that support these goals. This continued focus on sustainable farming practices is therefore driving the demand for biostimulants.
Growing Consumer Demand for Organic and Naturally Grown Produce: The rising consumer preference for organic and natural food products plays a crucial role in boosting the U.S. biostimulants market. Consumers are becoming more aware of what they eat and how it is produced, leading them to choose foods grown with fewer synthetic inputs. This trend directly encourages farmers to adopt practices, including the use of biostimulants, that align with organic and natural precision farming standards.
According to a survey highlighted by the Organic Trade Association (OTA) in a press release from February 2025 titled "Younger, health-conscious consumers are embracing organic, OTA survey shows," younger generations, especially Gen Z, are prioritizing organic choices, with nearly 90% of surveyed consumers in that age group being committed or new organic consumers. The USDA Organic label also earns deep trust, and health benefits are a key driver for organic purchases. This strong consumer pull for organic and naturally produced food increases the demand for biostimulants, which are often compatible with organic certification.
Source: Polaris Market Research Analysis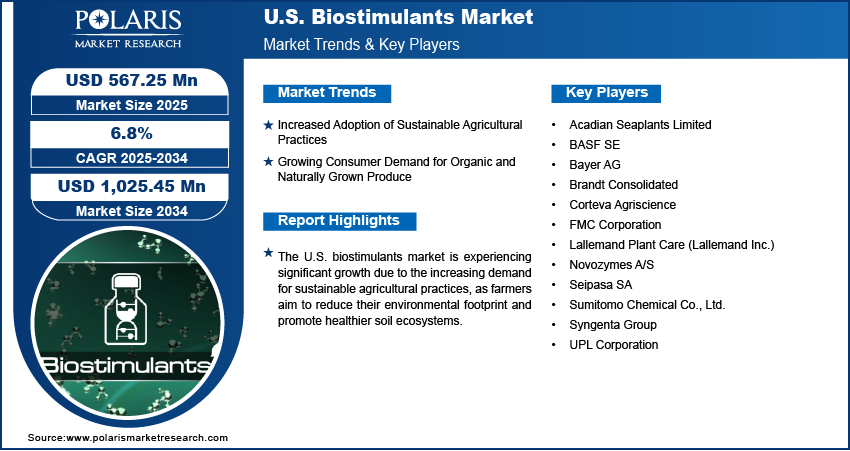
Get Full Segment-Level Forecasts & Insights: Download Sample Report
Segmental Insights
Active Ingredient Analysis
Based on active ingredient, the segmentation includes acid based, seaweed extract, microbial, and others. The acid-based segment held the largest share in 2024. This category primarily includes humic and fulvic acids, which are naturally occurring organic compounds found in soil. Their popularity stems from their proven effectiveness in enhancing nutrient uptake, improving soil structure, and increasing plant tolerance to various environmental stresses. These acids work by chelating essential nutrients, making them more available for plant absorption, and by stimulating beneficial microbial activity in the soil, leading to healthier root systems and overall plant vigor.
The microbial segment is anticipated to register the highest growth rate during the forecast period. This category includes beneficial microorganisms such as bacteria and fungi, which improve plant growth through various mechanisms such as nitrogen fixation, phosphorus solubilization, and the production of plant hormones. As farmers increasingly seek biological solutions to reduce chemical inputs and improve soil health, microbial biostimulants are gaining significant traction. Their ability to foster a healthy soil microbiome, enhance nutrient cycling, and increase plant resilience to diseases and abiotic stresses makes them a promising solution for sustainable and smart agriculture.
Crop Type Analysis
Based on crop type, the segmentation includes row crops & cereals, fruits & vegetables, turf & ornamentals, and others. The row crops & cereals segment held the largest share in 2024. This dominance is primarily due to the vast acreage dedicated to these crops, such as corn, wheat, and soybeans, across the country. Farmers cultivating these staple crops are increasingly adopting biostimulants to improve overall crop health, enhance nutrient use efficiency, and boost yields, especially in the face of varying environmental conditions. The extensive cultivation of row crops and cereals means that even a small per-acre application of biostimulants translates into a substantial volume, making this segment a significant contributor to the overall market size.
The fruits and vegetables segment is anticipated to register the highest growth rate during the forecast period. This rapid expansion is driven by a strong consumer demand for high-quality, residue-free, and organic produce. Biostimulants are highly valued in fruit and vegetable cultivation for their ability to improve fruit set, size, color, and shelf life, as well as to enhance the nutritional content of the produce. Growers of specialty crops often prioritize product quality and appearance, making biostimulants an attractive tool to meet market expectations.
Application Analysis
Based on application, the segmentation includes foliar treatment, soil treatment, and seed treatment. The foliar treatment segment held the largest share in 2024. This application method involves spraying biostimulant solutions directly onto plant leaves, allowing for rapid absorption of the active ingredients. The popularity of foliar application is fueled by its efficiency and the quick response observed in plants, as nutrients and beneficial compounds are readily available for metabolic processes. Farmers often favor this method because it allows for precise targeting of specific plant needs at various growth stages, helping to address nutrient deficiencies or abiotic stresses promptly.
The seed treatment segment is anticipated to register the highest growth rate during the forecast period. This method involves applying biostimulants directly to seeds before planting. Seed treatment offers several advantages, particularly in enhancing germination, promoting vigorous early seedling growth, and providing initial protection against environmental stresses and pathogens. By treating seeds, growers can give their crops a strong start, which is crucial for overall plant development and yield potential. The increasing focus on precision agriculture and the desire to optimize initial crop establishment are driving the demand for seed-applied biostimulants.
Source: Polaris Market Research Analysis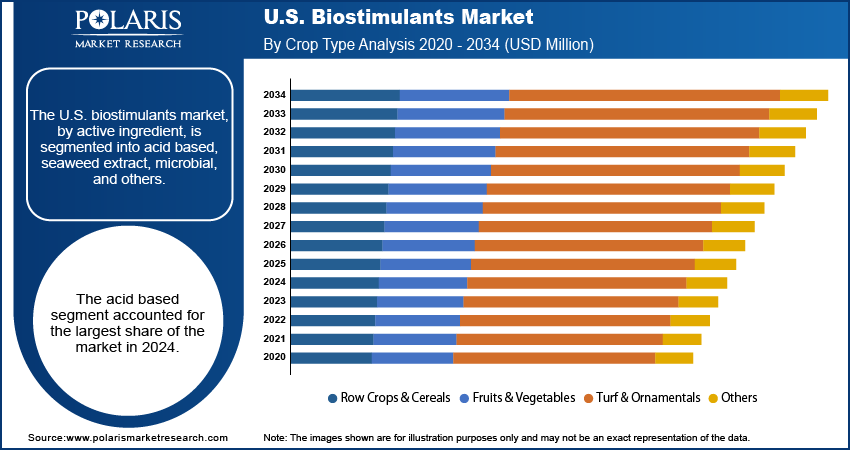
Need Granular Data Across All Market Segments? Request Customization
Key Players and Competitive Insights
The U.S. biostimulants market features a dynamic competitive landscape with both large, established agricultural companies and specialized biological solution providers. These players are actively engaged in research and development to introduce innovative products that cater to the increasing demand for sustainable and efficient agricultural practices. The competition is centered around product efficacy, formulation, and the ability to demonstrate clear benefits to growers in terms of yield, quality, and stress tolerance. Strategic partnerships, and mergers and acquisitions are common as companies focus on expanding their product portfolios and geographical reach.
A few prominent companies in the U.S. biostimulants market include BASF SE, Bayer AG, Corteva Agriscience, Syngenta Group (China National Chemical Corporation), UPL Corporation, FMC Corporation, Novozymes A/S, Brandt Consolidated, Acadian Seaplants Limited, Lallemand Inc., Seipasa SA, and Sumitomo Chemical Co., Ltd.
Key Players
- Acadian Seaplants Limited
- BASF SE
- Bayer AG
- Brandt Consolidated
- Corteva Agriscience
- FMC Corporation
- Lallemand Plant Care (Lallemand Inc.)
- Novozymes A/S
- Seipasa SA
- Sumitomo Chemical Co., Ltd.
- Syngenta Group (China National Chemical Corporation)
- UPL Corporation
Industry Developments
In October 2025, Summit Agro Chile SpA launched its BioPowered portfolio in the United States, combining biological active ingredients with crop protection chemicals, including biostimulants Tarma and Spurt.
In July 2025, Yara North America opened a biostimulant demo farm in Saskatoon to test products in real farming conditions and support regenerative agriculture.
In June 2025, Syngenta AG opened a 22,000 m² biologicals facility in Orangeburg, producing 16,000 metric tons of biostimulants per year and incorporating Novartis’ Strains and Natural Products collection.
In June 2025, The U.S. Plant Biostimulant Act of 2025 was introduced to clarify biostimulant regulations under FIFRA and encourage innovation.
In March 2025, Redox Bio-Nutrients introduced RDX-N, a stable botanical-extract biostimulant that enhances nitrogen metabolism, boosting synthetic liquid nitrogen efficiency by about 50%.
In November 2024, Syngenta Canada launched YieldON, a foliar biostimulant to improve yields in corn, wheat, and other row crops for the 2025 season.
In October 2024, Acadian Plant Health and BASF Agricultural Solutions announced a partnership to develop innovative agricultural solutions. This collaboration aims to market climate-resilient products for crop yield protection, with BASF leveraging Acadian's biostimulant technology to complement its existing portfolio.
In March 2024, FMC Corporation announced a collaboration with Novonesis (formerly Novozymes A/S) in Canada to bring innovative biological solutions to Canadian farmers.
U.S. Biostimulants Market Segmentation
By Active Ingredient Outlook (Revenue – USD Million, 2020–2034)
- Acid Based
- Seaweed Extract
- Microbial
- Others
By Crop Type Outlook (Revenue – USD Million, 2020–2034)
- Row Crops & Cereals
- Fruits & Vegetables
- Turf & Ornamentals
- Others
By Application Outlook (Revenue – USD Million, 2020–2034)
- Foliar Treatment
- Soil Treatment
- Seed Treatment
U.S. Biostimulants Market Report Scope
| Report Attributes | Details |
| Market Size in 2024 | USD 532.38 million |
| Market Size in 2025 | USD 567.25 million |
| Revenue Forecast by 2034 | USD 1,025.45 million |
| CAGR | 6.8% from 2025 to 2034 |
| Base Year | 2024 |
| Historical Data | 2020–2023 |
| Forecast Period | 2025–2034 |
| Quantitative Units | Revenue in USD million and CAGR from 2025 to 2034 |
| Report Coverage | Revenue Forecast, Competitive Landscape, Growth Factors, and Industry Insights |
| Segments Covered |
|
| Competitive Landscape |
|
| Report Format |
|
| Customization | Report customization as per your requirements with respect to countries, regions, and segmentation. |
Source: Polaris Market Research Analysis
U.S. Biostimulants Market FAQ's
The market size was valued at USD 532.38 million in 2024 and is projected to grow to USD 1,025.45 million by 2034.
The market is projected to register a CAGR of 6.8% during the forecast period.
A few key players in the market include BASF SE, Bayer AG, Corteva Agriscience, Syngenta Group (China National Chemical Corporation), UPL Corporation, FMC Corporation, Novozymes A/S, Brandt Consolidated, Acadian Seaplants Limited, Lallemand Inc., Seipasa SA, and Sumitomo Chemical Co., Ltd.
The acid-based segment accounted for the largest share of the market in 2024.
The fruits and vegetables segment is expected to witness the fastest growth during the forecast period.
Download Sample Report of U.S. Biostimulants Market
Please fill out the form to request a customized copy of the research report.
