
Reports

U.S. C-Reactive Protein Testing Market Demand, Growth Opportunity, 2025-2034
REPORT DETAILS
REPORT DETAILS
ABOUT THIS REPORT
Market Statistics
Overview
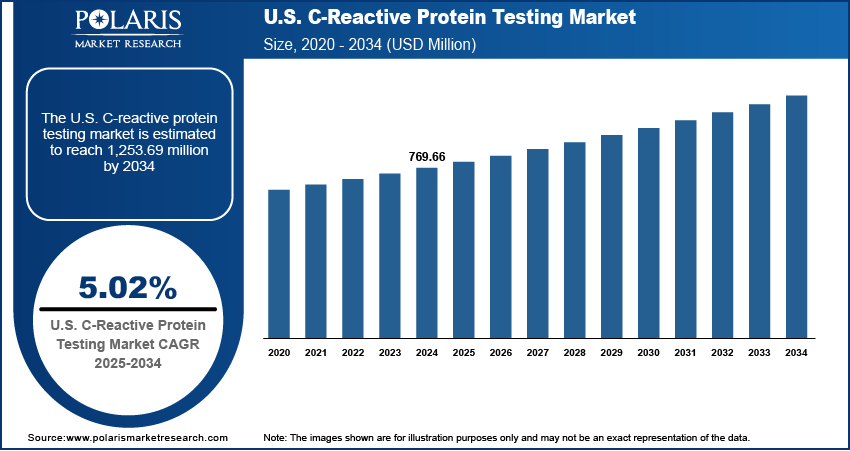
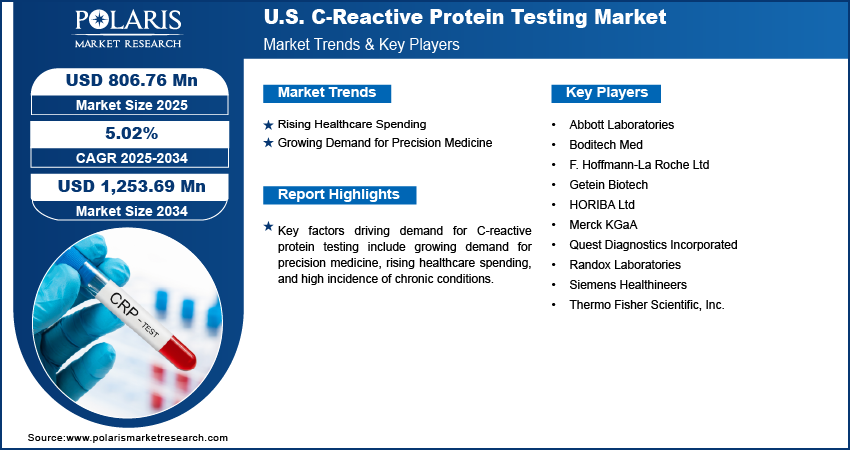
The U.S. C-reactive protein testing market size was valued at USD 769.66 million in 2024, growing at a CAGR of 5.02% from 2025 to 2034. Key factors driving demand for C-reactive protein testing include growing demand for precision medicine, rising healthcare spending, and high incidence of chronic conditions.
Key Insights
- The immuno-turbidimetric assay segment accounted for a major revenue share in 2024 due to its widespread adoption in clinical laboratories.
- The hs (high sensitivity) CRP segment is projected to grow at a robust pace in the coming years, owing to its critical role in cardiovascular risk assessment.
- The hospitals segment dominated the revenue share in 2024, as they serve as the primary centers for diagnosing and managing chronic conditions.
Industry Dynamics
- Increasing healthcare spending in the U.S. is boosting demand for C-reactive protein (CRP) testing by allowing hospitals, clinics, and laboratories to invest in advanced diagnostic technologies and expand testing capabilities.
- Growing demand for precision medicine is fueling the adoption of CRP testing as it provides critical insights to physicians to tailor treatments based on individual patient profiles.
- The rising aging population and growing cardiovascular disorders in the country are creating a lucrative market opportunity.
- One significant drawback of C-reactive protein testing is its lack of specificity, as it cannot distinguish the exact cause of inflammation.
AI Impact on U.S. C-Reactive Protein Testing Market
- AI enhances diagnostic precision by minimizing human error in CRP test interpretation.
- AI-driven algorithms accelerate result analysis, enabling quicker detection of inflammatory conditions.
- Integration with electronic health records allows AI to identify patterns and predict disease progression.
- Automation reduces manual workload, lowering operational costs and improving test accessibility.
Market Statistics
- 2024 Market Size: USD 769.66 Million
- 2034 Projected Market Size: USD 1,253.69 Million
- CAGR (2025-2034): 5.02%
C-reactive protein (CRP) testing is a blood test that measures the level of CRP, a substance produced by the liver in response to inflammation. High CRP levels may indicate infections, autoimmune conditions, or chronic diseases such as cardiovascular disorders. Doctors use this test to detect inflammation, monitor treatment effectiveness, and assess the risk of heart disease. It serves as a quick, reliable tool for diagnosing underlying health issues and guiding medical decisions.
The U.S. C-reactive protein testing market is showing a growing demand for diagnostic tools that support early disease detection and management. Rising cardiovascular disease prevalence, increased awareness of preventive healthcare, and the adoption of advanced diagnostic technologies are driving CRP testing expansion. Hospitals, clinics, and laboratories widely use CRP tests to monitor patient health and guide treatment. The U.S. is also witnessing growing use of high-sensitivity CRP (hs-CRP) testing to evaluate cardiovascular risks.
The demand for C-reactive protein testing in the U.S. is driven by the high incidence of chronic conditions. According to the Centers for Disease Control and Prevention, in 2023, 76.4% (representing 194 million) of US adults reported 1 or more chronic conditions. This is driving healthcare providers in the country to rely on C-reactive protein testing to monitor inflammation levels and disease progression. Patients with chronic conditions often require regular testing to evaluate treatment effectiveness and detect flare-ups or complications early. Hospitals, clinics, and diagnostic laboratories are increasingly integrating CRP testing into routine checkups for chronic disease management, which drives consistent utilization. Therefore, the growing burden of chronic diseases is directly increasing the need for accurate, quick, and cost-effective CRP testing solutions.
Drivers & Opportunities/Trends
Rising Healthcare Spending: Increasing healthcare spending in the U.S. is boosting demand for C-reactive protein (CRP) testing by allowing hospitals, clinics, and laboratories to invest in advanced diagnostic technologies and expand testing capabilities. According to the American Medical Association, health spending in the U.S. increased by 7.5% in 2023 to $4.9 trillion or $14,570 per capita. Patients with high healthcare spending benefit from better access to preventive care and early disease detection, which is increasing the use of CRP testing for inflammation-related conditions. Higher expenditure is also encouraging governments and private providers to strengthen diagnostic infrastructure, leading to wider availability of CRP testing services. Hence, as healthcare systems allocate more funding toward improving patient outcomes, the adoption of CRP testing rises rapidly.
Growing Demand for Precision Medicine: Precision medicine relies on accurate biomarkers to guide therapy decisions, and CRP testing provides critical insights to physicians into inflammation and disease activity, by which they tailor treatments based on individual patient profiles. Oncologists, cardiologists, and rheumatologists are increasingly incorporating CRP testing to monitor precision treatment response and adjust interventions in real time. Therefore, as personalized medicine or treatment approaches gain awareness, the need for reliable, rapid, and accessible CRP testing continues to rise across hospitals, clinics, and specialty care centers.
Segmental Insights
Assay Type Analysis
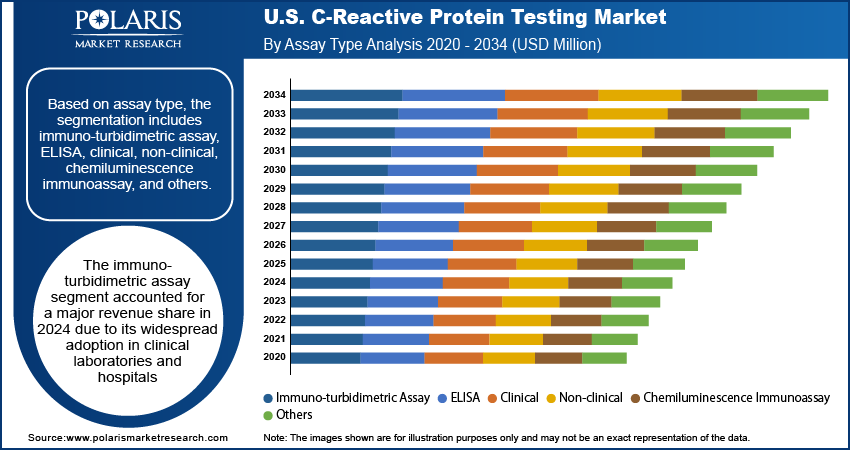
Based on assay type, the segmentation includes immuno-turbidimetric assay, ELISA, clinical, non-clinical, chemiluminescence immunoassay, and others. The immuno-turbidimetric assay segment accounted for a major revenue share in 2024 due to its widespread adoption in clinical laboratories and hospitals. Healthcare providers preferred this method as it offers high precision, rapid turnaround times, and cost-effectiveness compared to other testing techniques. The increasing prevalence of cardiovascular diseases, diabetes, and inflammatory disorders in the U.S. significantly boosted the demand for routine CRP testing, and immuno-turbidimetric assays emerged as the primary choice for large-scale diagnostic screening. Furthermore, the integration of these assays with automated laboratory analyzers enhanced workflow efficiency, enabling high-throughput testing and supporting their dominant position.
The chemiluminescence immunoassay segment is expected to grow at a rapid pace during the assessment period owing to its superior sensitivity and specificity, which make it highly effective in detecting low CRP concentrations for early disease diagnosis. Physicians increasingly rely on chemiluminescence methods for monitoring patients with chronic conditions such as sepsis, autoimmune diseases, and cancer, where precise quantification plays a critical role in treatment decisions. Moreover, technological advancements in analyzer platforms and the growing adoption of point-of-care testing devices that incorporate chemiluminescence technology further strengthen its prospects.
Detection Range Analysis
Based on detection range, the segmentation includes hs (high sensitivity) CRP, Conventional CRP, and cCRP. The hs (high sensitivity) CRP segment is projected to grow at a robust pace in the coming years, owing to its critical role in cardiovascular risk assessment and preventive healthcare. Physicians increasingly recommend hs-CRP testing to detect low levels of inflammation that conventional tests cannot identify, particularly for patients at risk of heart attack or stroke. Rising awareness among individuals about early detection of cardiovascular diseases, along with the growing focus on precision medicine, is fueling the demand for hs-CRP assays. Moreover, advancements in laboratory analyzers and point-of-care technologies are enhancing the accuracy and accessibility of hs-CRP testing.
Disease Area Analysis
In terms of disease area, the segmentation includes cardiovascular diseases, cancer, rheumatoid arthritis, inflammatory bowel disease, endometriosis, lupus, and others. The cardiovascular diseases segment held the largest revenue share in 2024 due to healthcare providers widely adopted CRP testing to evaluate inflammation levels linked to heart conditions. Physicians relied on CRP levels to assess the risk of heart attack, stroke, and other cardiovascular complications, which significantly influenced the demand for these tests. The high prevalence of obesity, diabetes, and hypertension across the U.S. population further accelerated the need for CRP-based diagnostics in cardiology. According to the Centers for Disease Control and Prevention, the prevalence of obesity among adults in the U.S. was 40.3% during August 2021–August 2023.
End Use Analysis
In terms of end use, the segmentation includes clinics, hospitals, laboratories, assisted living healthcare facilities, home care settings, and others. The hospitals segment dominated the revenue share in 2024 as they serve as the primary centers for diagnosing and managing a wide range of acute and chronic conditions. Physicians in hospitals relied heavily on CRP testing to monitor infections, cardiovascular complications, and inflammatory diseases in both emergency and inpatient departments. The availability of advanced diagnostic infrastructure, coupled with the ability to integrate CRP assays into high-throughput analyzers, further strengthened the dominance of the segment. Rising hospital admissions due to sepsis, respiratory infections, and lifestyle-related disorders also drove consistent demand for CRP tests in these facilities.
The home care settings segment is expected to grow at a robust pace in the coming years. The growing availability of portable point-of-care CRP analyzers enables individuals to monitor inflammation markers without visiting a clinical facility. This shift aligns with the rising focus on remote patient management and telehealth services, particularly for individuals with chronic conditions such as cardiovascular disease and rheumatoid arthritis. Moreover, the cost-effectiveness, convenience, and faster turnaround times associated with at-home CRP testing are projected to fuel the adoption.
Key Players & Competitive Analysis Report
The U.S. C-reactive protein (CRP) testing market is highly competitive, dominated by global diagnostics leaders such as Abbott Laboratories, Siemens Healthineers, Roche, and Thermo Fisher Scientific, offering high-sensitivity CRP assays across clinical and point-of-care platforms. Companies such as Quest Diagnostics provide centralized lab testing, while Getein Biotech and Boditech Med expand rapid testing accessibility. Randox and HORIBA focus on niche immunoassay technologies, and Merck KGaA supports reagent supply chains. Intense innovation, regulatory compliance, and demand for cardiovascular and inflammatory disease monitoring drive competition. Strategic partnerships, automation, and AI-integrated diagnostics are key differentiators. Players are investing in faster, more accurate, and cost-efficient CRP solutions to capture growing clinical and consumer demand.
Major companies operating in the U.S. C-reactive protein testing industry include Abbott Laboratories; Boditech Med; F. Hoffmann-La Roche Ltd; Getein Biotech; HORIBA Ltd; Merck KGaA; Quest Diagnostics Incorporated; Randox Laboratories; Siemens Healthineers; and Thermo Fisher Scientific, Inc.
Key Companies
- Abbott Laboratories
- Boditech Med
- F. Hoffmann-La Roche Ltd
- Getein Biotech
- HORIBA Ltd
- Merck KGaA
- Quest Diagnostics Incorporated
- Randox Laboratories
- Siemens Healthineers
- Thermo Fisher Scientific, Inc.
Industry Developments
- In September 2025, HORIBA announced a strategic partnership with GeodAIsics to co-develop an AI-powered early sepsis detection solution that integrates hematology analyzers, including HORIBA’s CRP-capable systems, to identify infection and inflammation patterns.
- In August 2025, Quest Diagnostics completed the acquisition of select clinical testing assets from Fresenius Medical Care’s Spectra Laboratories, strengthening its testing capabilities for chronic kidney disease.
- In December 2022, Siemens Healthcare GmbH received 510(k) clearance from the U.S. Food and Drug Administration (FDA) for its CardioPhase high-sensitivity C-reactive protein (hs-CRP) test.
U.S. C-Reactive Protein Testing Market Segmentation
By Assay Type Outlook (Revenue, USD Million, 2020–2034)
- Immuno-turbidimetric Assay
- ELISA
- Clinical
- Non-clinical
- Chemiluminescence Immunoassay
- Others
By Detection Range Outlook (Revenue, USD Million, 2020–2034)
- hs (high sensitivity) CRP
- Conventional CRP
- cCRP
By Disease Area Outlook (Revenue, USD Million, 2020–2034)
- Cardiovascular Diseases
- Cancer
- Rheumatoid Arthritis
- Inflammatory Bowel Disease
- Endometriosis
- Lupus
- Others
By End Use Outlook (Revenue, USD Million, 2020–2034)
- Clinics
- Hospitals
- Laboratories
- Assisted Living Healthcare Facilities
- Home Care Settings
- Others
U.S. C-Reactive Protein Testing Market Report Scope
| Report Attributes | Details |
| Market Size in 2024 | USD 769.66 Million |
| Market Size in 2025 | USD 806.76 Million |
| Revenue Forecast by 2034 | USD 1,253.69 Million |
| CAGR | 5.02% from 2025 to 2034 |
| Base Year | 2024 |
| Historical Data | 2020–2023 |
| Forecast Period | 2025–2034 |
| Quantitative Units | Revenue in USD Million and CAGR from 2025 to 2034 |
| Report Coverage | Revenue Forecast, Competitive Landscape, Growth Factors, and Industry Trends |
| Segments Covered |
|
| Competitive Landscape |
|
| Report Format |
|
| Customization | Report customization as per your requirements with respect to countries, regions, and segmentation. |
FAQ's
The market size was valued at USD 769.66 million in 2024 and is projected to grow to USD 1,253.69 million by 2034.
The market is projected to register a CAGR of 5.02% during the forecast period.
A few of the key players in the market are Abbott Laboratories; Boditech Med; F. Hoffmann-La Roche Ltd; Getein Biotech; HORIBA Ltd; Merck KGaA; Quest Diagnostics Incorporated; Randox Laboratories; Siemens Healthineers; and Thermo Fisher Scientific, Inc.
The immuno-turbidimetric assay segment dominated the market revenue share in 2024.
The home care setting segment is projected to witness the fastest growth during the forecast period.
Download Sample Report of U.S. C-Reactive Protein Testing Market
Please fill out the form to request a customized copy of the research report.
