
U.S. Earplugs Market Demand Scenario, Developments, and Growth Prospects 2025-2034
REPORT DETAILS
Market Statistics
Market Overview
The U.S. earplugs market size was valued at USD 400.68 million in 2024 and is anticipated to register a CAGR of 7.0% from 2025 to 2034. The earplugs demand is mainly driven by strict government rules for workplace safety. These rules make it necessary to use hearing protection in noisy places such as construction sites and factories. Also, more people are becoming aware of hearing loss and hearing aids and are using earplugs for personal reasons such as concerts, travel, and sleeping.
Key Insights
- By material, the foam earplugs segment holds the largest share in 2024 due to its wide use in industrial settings and consumer applications.
- By technology, the passive earplugs segment dominates the market as they are a simple, reliable, and cost-effective solution for noise reduction.
- Based on type, the disposable segment holds the largest share because of its use in industrial environments.
- By noise reduction rating, the 26-29 dB NRR segment leads the market as it offers a balance of strong noise reduction.
- In terms of application, the industrial & occupational segment dominates the landscape as a result of strict government regulations for workplace safety.
Industry Dynamics
- Stringent government safety rules for worker protection are a major drivers. These rules, set by groups such as OSHA and NIOSH, require employers to provide hearing protection in loud work environments. This pushes companies in industries such as construction, manufacturing, and mining to buy earplugs in bulk.
- A growing number of people are becoming aware of noise-induced hearing loss. This is leading to a rise in the use of earplugs for personal reasons. More people are choosing to wear them for activities such as concerts, traveling, and sleeping to protect their hearing from loud sounds.
- Technological advances have made earplugs better in terms of comfort, material, and performance. Innovations include custom-fit designs, reusable materials, and smart earplugs with built-in features. These improvements meet the needs of different users and make the products more appealing.
Market Statistics
- 2024 Market Size: USD 400.68 million
- 2034 Projected Market Size: USD 786.35 million
- CAGR (2025–2034): 7.0%
Source: Polaris Market Research Analysis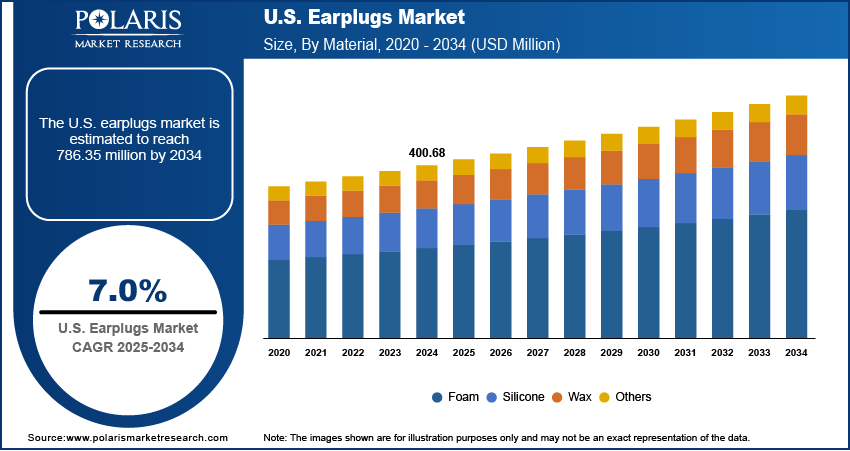
Want a Deeper Look at Key Market Players? Download Sample Report
AI Impact on U.S. Earplugs Market
- In professional setup, AI-enabled earplugs can monitor usage patterns. Based on the patterns, the technology alerts users when replacements are needed, enhancing safety compliance.
- By using AI-powered 3D scanning and modeling, manufacturers can create customized earplugs tailored to individual ear shapes. It improves comfort and acoustic performance.
- In hospitals, AI-integrated earplugs are used for patient monitoring and noise reduction.
- Workers use smart earplugs to stay protected while maintaining situational awareness.
An earplug is a small device inserted into the ear canal to protect the user from loud noises or other elements such as water, wind, and dust. They are a form of hearing protection used to prevent noise-induced hearing loss and can also improve sleep quality by blocking out unwanted sounds. Earplugs come in various materials, including foam, silicone, and wax, and can be disposable or reusable.
The increasing popularity of recreational and entertainment activities propels the demand for earplugs across the U.S. People are using earplugs more often to protect their hearing during concerts, music festivals, and other loud events. With greater awareness of the long-term effects of noise exposure, consumers are taking proactive steps to safeguard their hearing health during leisure time.
Another driver is the increasing use of earplugs for improved sleep quality. Many people living in noisy urban areas or sharing a bedroom with a snoring partner use earplugs to block out sound and get better rest. The CDC notes that poor sleep can lead to various health problems, which has led to a rise in products that promote better sleep, including earplugs. This growing emphasis on personal wellness and sleep health contributes to the rising demand for these products.
Drivers and Trends
Increasing Awareness of Noise-Induced Hearing Loss: The increasing awareness of the dangers of noise-induced hearing loss is a significant driver for the earplugs market. People are becoming more educated about how both short and long-term exposure to loud noise can cause permanent damage to their hearing, hearing amplifiers, and how to seek hearing loss disease treatment. This awareness is leading to a shift in behavior, with more individuals choosing to use hearing protection in various situations, not just at work. The focus is moving from just protecting against occupational noise to personal hearing protection during recreational and daily activities.
The World Health Organization (WHO) highlighted that over 80% of global ear and hearing care needs are not being met. This report also pointed out that deeply ingrained social ideas and the stigma of hearing loss are major factors that limit efforts to prevent it. This growing understanding of the effects of noise and the need for early prevention is driving consumer demand for accessible solutions such as earplugs.
Rising Demand from Industrial and Workplace Safety Regulations: Stricter government regulations regarding workplace safety and hearing conservation programs are a primary driver for the U.S. earplugs market. Federal agencies have established clear rules that require employers to protect their workers from hazardous noise levels. Companies across different industries must follow these rules, which often means providing employees with appropriate hearing protection devices, including earplugs.
According to a 2023 report from the Occupational Safety and Health Administration (OSHA), worker injuries and illnesses were down to 2.4 incidents per 100 workers. The enforcement of safety standards, such as those related to noise exposure, contributes to this trend. OSHA requires employers to have a hearing conservation program in place when noise exposures equal or exceed 85 decibels. This mandate ensures a consistent and high demand for hearing protection products, which drives growth in the market.
Source: Polaris Market Research Analysis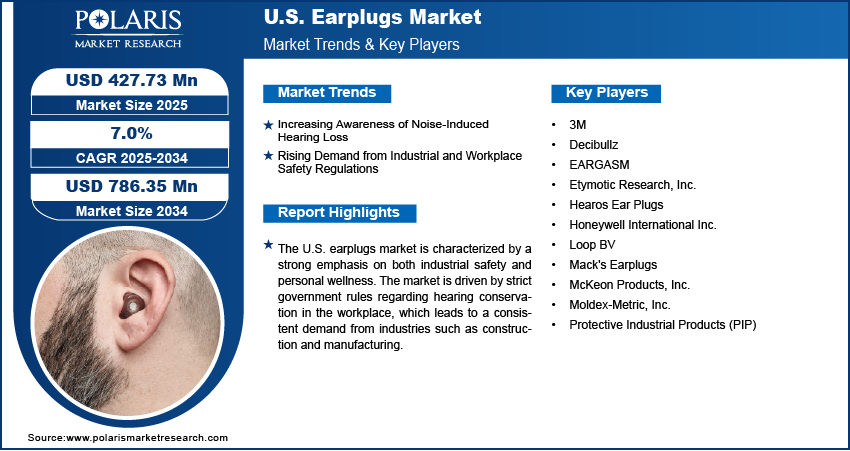
Get Full Segment-Level Forecasts & Insights: Download Sample Report
Segmental Insights
Material Analysis
Based on material, the U.S. earplugs market segmentation includes foam, silicone, wax, and others. The foam segment held the largest share in 2024. This is because foam earplugs are very popular for both industrial and consumer use. They are known for being affordable, widely available, and highly effective at blocking out noise. The soft, expandable material conforms well to the ear canal, providing a good seal for noise reduction. Because of this, they are the go-to choice for many workplaces that must follow strict safety rules. They are also a common choice for personal use, such as for sleeping or traveling, because they are easy to use and disposable. The large-scale use in both professional and everyday settings makes this subsegment the dominant one in the market.
The silicone segment is anticipated to register the highest growth rate during the forecast period. This is largely due to the increasing demand for reusable and more advanced earplugs. Silicone products are durable, easy to clean, and can be used many times, making them a more cost-effective and environmentally friendly choice in the long run. They are also often used for specific purposes, such as swimming, because they create a watertight seal. The growing trend of personal wellness and the use of earplugs for activities like concerts and sports are also contributing to this growth. Manufacturers are developing innovative silicone earplugs with features such as custom molding and special filters to appeal to a wider range of consumers. This focus on durability, comfort, and specialized applications is driving the strong growth of the silicone segment.
Technology Analysis
Based on technology, the U.S. earplugs market segmentation includes active earplugs and passive earplugs. The passive earplugs segment held the largest share in 2024. These earplugs are the most traditional type and work by using materials to physically block sound from entering the ear canal. They are widely used across various industries, such as construction and manufacturing, where a simple and reliable way to reduce constant loud noise is needed. Their simplicity and low cost make them the preferred choice for companies buying in large quantities for their employees. They are also popular among consumers for everyday use, such as sleeping or studying, due to their ease of use and affordability. The broad use in both industrial and personal settings makes this segment dominant in the market.
The active earplugs segment is anticipated to register the highest growth rate during the forecast period. This is because these products use advanced technology to block noise and enhance certain sounds. Active earplugs have electronic components that can filter out harmful sounds while letting users hear important things like speech or warning signals. This feature is very useful in complex noise environments, such as on shooting ranges or in military settings. As consumers become more interested in high-tech products for both safety and convenience, the demand for active earplugs is growing. The ability to customize the listening experience and the ongoing improvements in technology are making these products more appealing to a wider range of users, which is driving the fast growth of this subsegment.
Type Analysis
Based on type, the U.S. earplugs market segmentation includes disposable and reusable. The disposable segment held the largest share in 2024. This is due to its widespread use in industrial and occupational settings where hygiene is a top priority. In places such as construction sites and manufacturing plants, workers often need new earplugs for each shift to prevent the spread of germs and ensure a proper fit. These products are also very affordable, making them a practical choice for companies that buy in large quantities. Their convenience and low cost also make them popular for one-time use at events such as concerts or for travel. The high demand from both industrial and personal users who prioritize cleanliness and cost-effectiveness gives the disposable subsegment its dominant position in the market.
The reusable subsegment is anticipated to register the highest growth rate during the forecast period. This is largely because of a growing focus on sustainability and long-term value among consumers. As people become more environmentally aware, they are choosing products they can use over and over again, which reduces waste. Reusable earplugs, which are often made from materials like silicone, are durable and can be easily cleaned. They also offer better long-term savings compared to constantly buying disposable ones. The demand for customizable and high-quality earplugs for activities like swimming, sleeping, and attending music events is also fueling this growth. Consumers are willing to pay more for a product that is comfortable, reliable, and aligns with their lifestyle, which is driving the strong growth in the reusable earplugs segment.
Noise Reduction Rating Analysis
Based on noise reduction rating, the U.S. earplugs market segmentation includes 10 - 20 dB, 21 - 25 dB, 26 - 29 dB, and 30 - 33 dB. The 26 - 29 dB segment held the largest share in 2024. These products provide a strong level of protection that meets or exceeds the requirements for many loud work environments. Industries like construction, manufacturing, and aviation often have noise levels that require this specific range of noise reduction to comply with federal safety standards. Because of their ability to block a significant amount of harmful noise while still being comfortable enough for all-day wear, they are a common choice for employers. This balance of high performance and practicality for professional use is what makes this NRR segment the largest in the market.
The NRR of 21-25 dB is anticipated to register the highest growth rate during the forecast period. This is attributed to the increasing use of earplugs for personal and recreational purposes. While a higher NRR is necessary for very loud work settings, a moderate NRR is often enough for activities like attending concerts, studying in a noisy cafe, traveling, or sleeping. As more people become aware of the need to protect their hearing in these everyday situations, they are seeking products that offer a good level of noise reduction without completely isolating them from their surroundings. This growth in personal wellness and leisure activities is driving the demand for these moderately rated earplugs.
Source: Polaris Market Research Analysis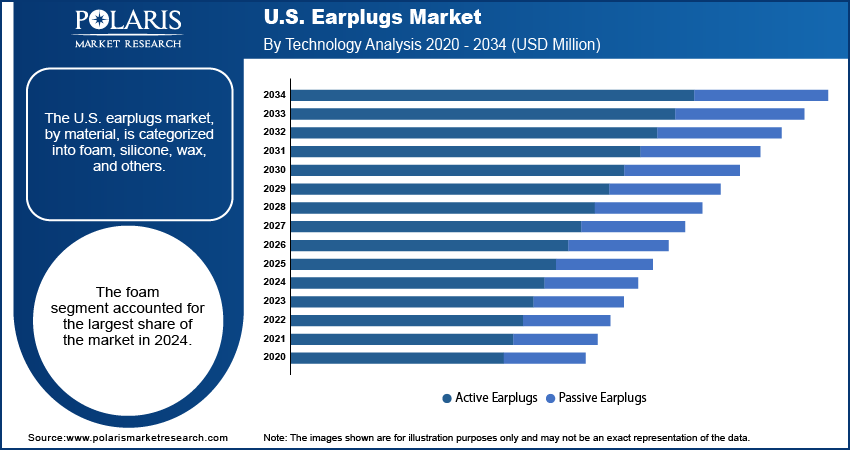
Need Granular Data Across All Market Segments? Request Customization
Key Players and Competitive Insights
The U.S. earplugs market is moderately competitive, with a few large companies holding a significant share alongside several smaller, niche players. The main competition is centered around product innovation, with companies constantly working on improving comfort, materials, and noise reduction capabilities. While large players have strong brand recognition and extensive distribution networks, smaller companies often focus on specialized products, such as custom-fit or technologically advanced active earplugs, to attract specific consumer groups. Mergers and acquisitions are also a part of the competitive landscape, as companies look to expand their product portfolios and market reach.
A few prominent companies in the industry include 3M; Honeywell International Inc.; Moldex-Metric, Inc.; McKeon Products, Inc.; Etymotic Research, Inc.; Hearos Ear Plugs; Protective Industrial Products (PIP); Decibullz; EARGASM; Loop BV; and Mack's Earplugs.
Key Players
- 3M
- Decibullz
- EARGASM
- Etymotic Research, Inc.
- Hearos Ear Plugs
- Honeywell International Inc.
- Loop BV
- Mack's Earplugs
- McKeon Products, Inc.
- Moldex-Metric, Inc.
- Protective Industrial Products (PIP)
Industry Developments
May 2025: Protective Industrial Products, Inc. acquired Honeywell’s PPE business, adding brands such as Howard Leight and Fibre-Metal to its portfolio. The acquisition strengthens PIP’s U.S. market presence and expands its hearing, eye, head, and industrial safety product offerings.
January 2025: Sennheiser introduced SoundProtex earplugs, featuring a two-stage acoustic filter for balanced sound reduction without loss of audio clarity. Made from hypoallergenic, reusable materials, the earplugs are designed for concerts, travel, and noisy environments.
February 2024: Protective Industrial Products, Inc. launched its first sustainable bio-based earplug, reinforcing its focus on eco-friendly hearing protection solutions within the PPE market.
May 2023: EarPeace collaborated with NEXX Helmets to introduce a specialized line of earplugs for motorcyclists, featuring EarPeace’s Contour earplugs in a custom NEXX Cherry color.
U.S. Earplugs Market Segmentation
By Material Outlook (Revenue – USD Million, 2020–2034)
- Foam
- Silicone
- Wax
- Others
By Technology Outlook (Revenue – USD Million, 2020–2034)
- Active Earplugs
- Passive Earplugs
By Type Outlook (Revenue – USD Million, 2020–2034)
- Disposable
- Reusable
By Noise Reduction Rating Outlook (Revenue – USD Million, 2020–2034)
- 10 - 20 dB
- 21 - 25 dB
- 26 - 29 dB
- 30 - 33 dB
By Application Outlook (Revenue-USD Million, 2020-2034)
- Industrial & Occupational
- Consumer Applications
U.S. Earplugs Market Report Scope:
| Report Attributes | Details |
| Market Size in 2024 | USD 400.68 million |
| Market Size in 2025 | USD 427.73 million |
| Revenue Forecast by 2034 | USD 786.35 million |
| CAGR | 7.0% from 2025 to 2034 |
| Base Year | 2024 |
| Historical Data | 2020–2023 |
| Forecast Period | 2025–2034 |
| Quantitative Units | Revenue in USD million and CAGR from 2025 to 2034 |
| Report Coverage | Revenue Forecast, Competitive Landscape, Growth Factors, and Industry Insights |
| Segments Covered |
|
| Competitive Landscape |
|
| Report Format |
|
| Customization | Report customization as per your requirements with respect to countries, regions, and segmentation. |
Source: Polaris Market Research Analysis
U.S. Earplugs Market FAQ's
The market size was valued at USD 400.68 million in 2024 and is projected to grow to USD 786.35 million by 2034.
The market is projected to register a CAGR of 7.0% during the forecast period.
A few key players in the market include 3M; Honeywell International Inc.; Moldex-Metric, Inc.; McKeon Products, Inc.; Etymotic Research, Inc.; Hearos Ear Plugs; Protective Industrial Products (PIP); Decibullz; EARGASM; Loop BV; and Mack's Earplugs.
The foam segment accounted for the largest share of the market in 2024.
The active earplugs segment is expected to witness the fastest growth during the forecast period.
The disposable earplugs segment holds the largest share due to hygiene benefits and high industrial demand.
The 26-29 dB NRR segment leads by balancing strong noise protection and comfort for workplace use.
Download Sample Report of U.S. Earplugs Market
Please fill out the form to request a customized copy of the research report.
