
U.S. Industrial Lubricants Market Trends, Forecasts, and Key Players 2025-2034
REPORT DETAILS
Market Statistics
Market Overview
The U.S. industrial lubricants market size was valued at USD 7.65 billion in 2024, growing at a CAGR of 3.10% during 2025–2034. High-performance industrial lubricant demand has increased with the growth of the automotive and aviation industries in the U.S. and focus towards sustainability and environmental compliance concerning industrial operations.
Key Insights
- In 2024, the manufacturing sector led the U.S. industrial lubricants market due to high production and frequent uses of high-performance lubricants in factories.
- The energy sector is expected to expand at the highest CAGR through the forecast period owing to increased investment in renewables and usage of hard-wearing lubricants in power generation and drilling.
Industry Dynamics
- Growing sales of motor vehicles, aerospace, and energy sectors are propelling lubricant demand throughout the U.S.
- The growing emphasis on sustainability and environmental regulations is boosting the application of recyclable and bio-based lubricants.
- Synthetic formulation developments and incorporation of predictive maintenance systems are driving opportunities for growth driven by efficiency.
- Volatility in crude oil prices and stringent regulatory requirements are restraining cost stability and market expansion.
Market Statistics
- 2024 Market Size: USD 7.65 Billion
- 2034 Projected Market Size: USD 10.37 Billion
- CAGR (2025–2034): 3.10%
The U.S. industrial lubricants market is prompted by manufacturing production growth, growth of heavy industries and increased energy production activity. Lubricants such as engine oils, hydraulic fluids, gear oils, metalworking fluids and greases play a critical role in friction reduction, wear prevention and equipment reliability in varied applications. Companies are creating high-performance synthetic formulations, bio-based alternatives and performance additives to increase oil life, minimize maintenance expenses and enhance the efficiency of machines. Adherence to quality and safety standards under bodies like the Environmental Protection Agency (EPA) and the American Petroleum Institute (API) is promoting uniform product uptake across industrial lines.
Growing need for productive and high-performance lubricants is growing in automotive, aerospace, energy and construction equipment repair. The emerging lubricants technology that offers low-viscosity, anti-wear additives and eco-friendly are increasing run times and minimizing downtime in production facilities. Industrial operators are introducing digital monitoring systems and predictive maintenance platforms to optimize lubricant usage to enhance equipment condition and minimize unplanned shutdowns.
Source: Polaris Market Research Analysis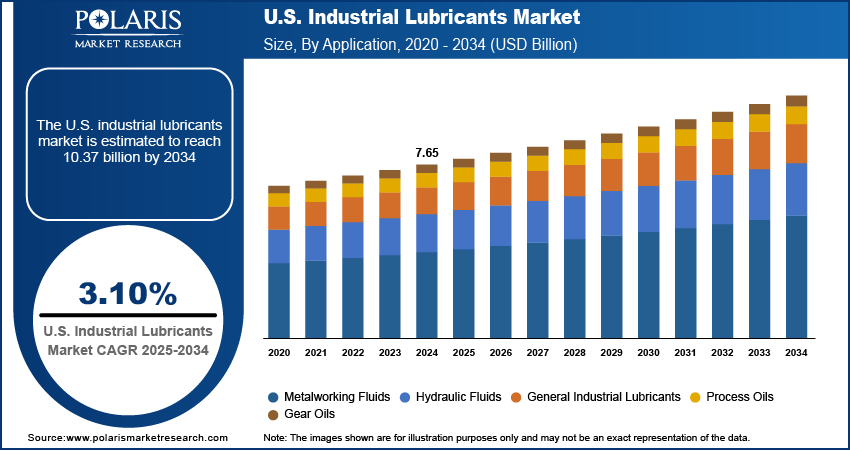
Want a Deeper Look at Key Market Players? Download Sample Report
The growth of the U.S. industrial lubricant sector is being supported by government initiatives in support of manufacturing and infrastructure. Lubricant changes along with the industrial cluster's expansion and process automation. Sustainability is the driving force behind energy-efficient recyclable and bio-based lubricants. For example, in February 2024, Kraton released SYLVASOLV, 100% biobased hydrocarbon oils for use in agrochemicals, adhesives, lubricants, and coatings, with products like SYLVASOLV 1000 for fertilizer coatings and crop protection.
Drivers & Opportunities
Expansion of automotive, aerospace and energy sectors: The U.S. market for industrial lubricants is expanding fast with growth in automotive aerospace and energy applications. Automotive manufacturing rose from 9.15 million units in 2021 to 10.56 million units in 2024, demonstrating a 15.4% increase reported by OICA, causing sustained lubricant consumption in engines transmissions and assembly. Aerospace and the energy sectors depend upon high-performance greases and oils for efficiency safety and functioning dependability. Increasing investment in industrial infrastructure further increases demand as lubricants help minimize downtime and guarantee equipment longevity.
Sustainability focus and regulatory compliance are driving demand for bio-based and recyclable lubricants: The shift towards sustainable operations in the U.S. is fueling greater use of lubricants in industry. Environmental compliance with carbon and waste reduction are hugely impacted by the manufacturers. According to consistent performance requirements, bio-based and recyclable lubricants are being used increasingly in support of sustainability objectives. Automotive, aerospace and energy industries utilize these lubricants, while circular economy efforts provide support for their long-term demand.
Source: Polaris Market Research Analysis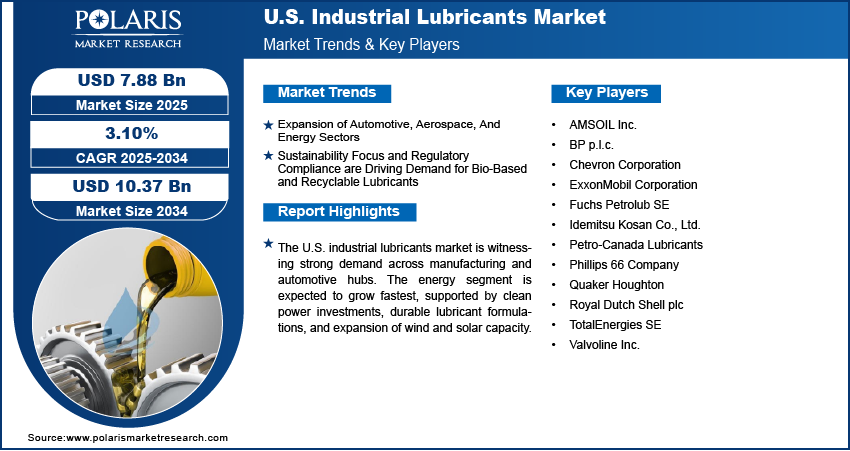
Get Full Segment-Level Forecasts & Insights: Download Sample Report
Segmental Insights
Base Oil Type Analysis
On the basis of base oil type, segmentation comprises mineral oils, synthetic oils, bio-based oils, and recovered oils. Mineral oils hold major shares in the U.S. industrial lubricant market owing to price and availability. These oils are applied across the automotive, manufacturing and construction sectors for engines, hydraulic equipment and machining. In addition, the existence of well-developed supply chains and tested reliability guarantee constant demand for the industrial lubricants throughout the nation.
The synthetic oils segment is expected to grow at the highest CAGR over the forecast period, attributable to their improved performance in heavy-duty applications. These oils have improved service life, thermal stability and durability against oxidation. Besides, sectors include aerospace and automobile that allow their transition to synthetic oils in high-load operations. In addition, increasing adoption of automation and predictive maintenance is fueling lubricant demand for enhancing efficiency and minimizing downtime.
Application Analysis
By application, the segmentation comprises metalworking fluids, hydraulic fluids, industrial lubricants in general, process oils and gear oils. The metalworking fluids segment led the U.S. industrial lubricants market in 2024, fueled by strong demand from automotive and aerospace component manufacturing. Metalworking fluids minimize friction, manage heat, and prolong tool life in machining and forming processes. In addition, ongoing expansion in industrial clusters is generating consistent demand for metalworking fluids to provide efficiency, precision, and reliability in mass production facilities throughout the nation.
The hydraulic fluids category is expected to expand at the highest CAGR over the forecast period owing to increasing adoption of heavy-duty equipment and robots. Hydraulic fluids provide smooth power transfer, guard system components, and promote operational safety. Further, growth of construction and energy projects is also increasing demand for industrial lubricants for heavy equipment, turbines, and power generation machines. In addition, producers are presenting sophisticated biodegradable and anti-wear hydraulic formulations that address sustainability goals without compromising durability and performance in advanced equipment.
End User Analysis
By end user, the market is segmented into manufacturing, automotive, aerospace, energy, and construction. The manufacturing segment led the U.S. industrial lubricants market in 2024 due to growing machinery installations and manufacturing output. The lubricants contribute to reducing downtime, extending service life, and improving the reliability of equipment in manufacturing units.
The energy segment is also expected to expand at the highest CAGR during the forecast period, driven by investment in renewable and traditional energy projects. Clean power manufacturing today contributes USD 18 billion annually to the GDP as well as employs 122,000 people in the US, says the American Clean Power Association. In 2030, it will contribute USD 86 billion annually to the GDP and create more than 575,000 jobs. Lubricants play a critical role in turbines, compressors, and drilling machinery to facilitate efficiency and save on maintenance costs. Moreover, the growth in wind and solar capacity is also boosting demand for long-lasting lubricants. Additionally, high-performance formulations that can endure harsh conditions are fueling demand in both power generation and exploration activity.
Source: Polaris Market Research Analysis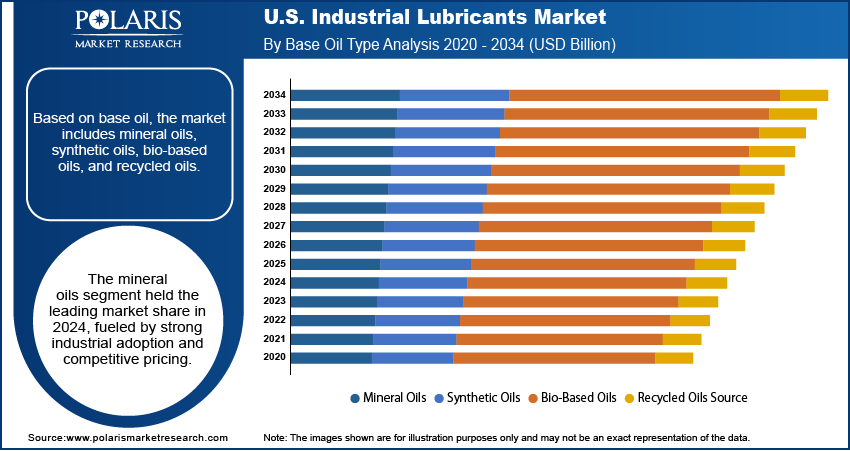
Need Granular Data Across All Market Segments? Request Customization
Key Players & Competitive Analysis Report
The U.S. industrial lubricants market is moderately competitive, based on increasing demand from the manufacturing, automotive, aerospace, energy, and construction industries. Dominant players are emphasizing sophisticated formulations, synthetic and bio-based oils, and robust supply chains to meet varied industrial uses. Competitive positioning is based on developments in high-performance additives, predictive maintenance, and environment-compliant products. Producers are enhancing operational effectiveness through digital monitoring systems, automated blending platforms, and rationalized distribution networks.
Key companies in the U.S. industrial lubricants industry include ExxonMobil Corporation, Chevron Corporation, Royal Dutch Shell plc, BP p.l.c., Phillips 66 Company, Valvoline Inc., TotalEnergies SE, Petro-Canada Lubricants, Fuchs Petrolub SE, AMSOIL Inc., Idemitsu Kosan Co., Ltd., and Quaker Houghton.
Key Players
- AMSOIL Inc.
- BP p.l.c.
- Chevron Corporation
- ExxonMobil Corporation
- Fuchs Petrolub SE
- Idemitsu Kosan Co., Ltd.
- Petro-Canada Lubricants
- Phillips 66 Company
- Quaker Houghton
- Royal Dutch Shell plc
- TotalEnergies SE
- Valvoline Inc.
Industry Developments
In June 2025, BP p.l.c. initiated the sale of its Castrol lubricants unit, valued at up to USD 10 billion, as part of a USD 20 billion divestment plan.
In June 2025: UE Systems and perma USA introduced the UltraTrak VARIO, a lubrication system equipped with ultrasonic sensors for real-time monitoring and automated maintenance.
In April 2025, Blue Tide Environmental opened a 5,000-barrels-per-day Group II used-oil re-refinery in Baytown, with capacity partly allocated to Pennzoil-Quaker State, a subsidiary of Shell plc.
In April 2024, GP Lubricants launched into the U.S. market with a complete line of automotive, industrial, marine, and aviation lubricants. The business is forecasted to expand its presence through distributor alliances and brand development activities, capitalizing on its worldwide petroleum experience.
U.S. Industrial Lubricants Market Segmentation
By Base Oil Type Outlook (Revenue, USD Billion, 2020–2034)
- Mineral Oils
- Synthetic Oils
- Bio-Based Oils
- Recycled Oils Source
By Application Outlook (Revenue, USD Billion, 2020–2034)
- Metalworking Fluids
- Hydraulic Fluids
- General Industrial Lubricants
- Process Oils
- Gear Oils
By End User Outlook (Revenue, USD Billion, 2020–2034)
- Manufacturing
- Automotive
- Aerospace
- Energy
- Construction
U.S. Industrial Lubricants Market Report Scope
| Report Attributes | Details |
| Market Size in 2024 | USD 7.65 Billion |
| Market Size in 2025 | USD 7.88 Billion |
| Revenue Forecast by 2034 | USD 10.37 Billion |
| CAGR | 3.10% from 2025 to 2034 |
| Base Year | 2024 |
| Historical Data | 2020–2023 |
| Forecast Period | 2025–2034 |
| Quantitative Units | Revenue in USD Billion and CAGR from 2025 to 2034 |
| Report Coverage | Revenue Forecast, Competitive Landscape, Growth Factors, and Industry Trends |
| Segments Covered |
|
| Competitive Landscape |
|
| Report Format |
|
| Customization | Report customization as per your requirements with respect to countries, regions, and segmentation. |
Source: Polaris Market Research Analysis
U.S. Industrial Lubricants Market FAQ's
The U.S. market size was valued at USD 7.65 billion in 2024 and is projected to grow to USD 10.37 billion by 2034.
The U.S. market is projected to register a CAGR of 3.10% during the forecast period.
A few of the key players in the market are ExxonMobil Corporation, Chevron Corporation, Royal Dutch Shell plc, BP p.l.c., Phillips 66 Company, Valvoline Inc., TotalEnergies SE, Petro-Canada Lubricants, Fuchs Petrolub SE, AMSOIL Inc., Idemitsu Kosan Co., Ltd., and Quaker Houghton.
The mineral oils segment dominated the market in 2024, driven by wide availability, cost-effectiveness, and extensive use across manufacturing, automotive, and heavy machinery applications.
The energy segment is projected to grow at the fastest CAGR, fueled by rising investments in renewable and conventional energy projects, along with demand for advanced lubricants in turbines, compressors, and drilling equipment.
Download Sample Report of U.S. Industrial Lubricants Market
Please fill out the form to request a customized copy of the research report.
