
U.S. Pearlescent Pigment Market Growth Rate, Volume, and Forecast, 2025-2034
REPORT DETAILS
Market Statistics
Overview
The U.S. pearlescent pigment market size was valued at USD 245.13 million in 2024, growing at a CAGR of 6.1% from 2025 to 2034. The growth is driven by strong demand from the automotive industry and the growth of the cosmetic industry.
Key Insights
- In 2024, the titanium dioxide mica segment dominated with the largest share due to their strong optical effects, stability, and wide applicability.
- The natural pearl essence segment is expected to experience significant growth during the forecast period as consumers and brands shift toward cleaner, sustainable ingredients.
- In 2024, the paints & coatings segment dominated the U.S. pearlescent pigment market with the largest share as these pigments are widely used in the automotive, construction, and consumer goods sectors to improve surface aesthetics and provide protective finishes.
- The printing inks segment is expected to experience significant growth during the forecast period due to rising demand in packaging, branding, and promotional materials.
Source: Polaris Market Research Analysis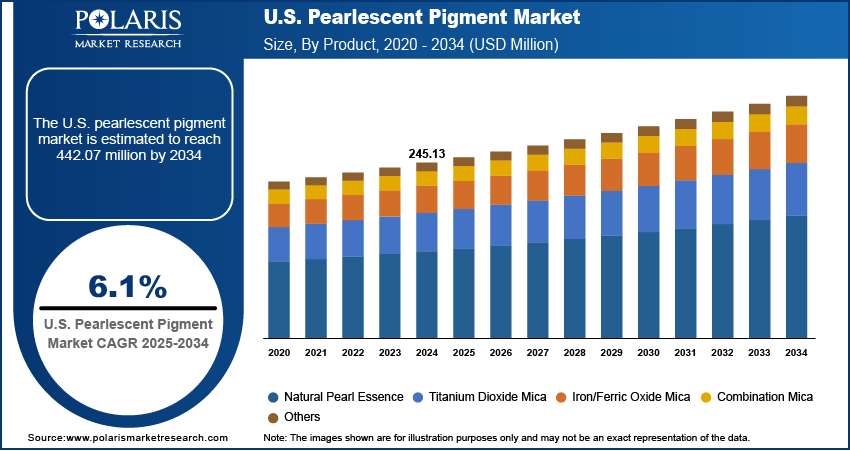
To Understand More About this Research: Download Sample Report
Pearlescent pigments are special-effect pigments that produce a shimmering, iridescent look similar to that of natural pearls. These pigments are usually created by coating mica flakes with metal oxides, such as titanium dioxide. By reflecting and refracting light, they are widely used in coatings, plastics, cosmetics, and inks for decorative and aesthetic purposes.
The U.S. packaging industry is undergoing a transformation, with strong demand for visually appealing and brand-distinctive designs. Pearlescent pigments offer eye-catching shimmer and depth to labels, cartons, and flexible packaging, helping brands stand out on store shelves and digital platforms. High-end consumer goods, including cosmetics, electronics, and personal care items, rely on pearlescent finishes to convey luxury and quality. Packaging that photographs well and improves the unboxing experience becomes more important as e-commerce continues to grow. These visual and branding needs are driving steady growth in the use of pearlescent pigments in the U.S. packaging applications.
Environmental concerns and stringent regulations in the U.S. are pushing manufacturers to adopt safer, sustainable materials. Pearlescent pigments made from natural mica or free from heavy metals are in high demand due to their low environmental impact and compliance with EPA and FDA standards. Brands across cosmetics, packaging, and coatings are investing in “green” innovation to appeal to eco-conscious consumers. The U.S. further leads in sustainability certifications and clean-label initiatives, making regulatory compliance a strong factor. This ongoing shift toward cleaner, more responsible product formulations significantly boosts the demand for environmentally friendly pearlescent pigments in the U.S., thereby driving the U.S. pearlescent pigment market growth.
Industry Dynamics
- Strong demand from the automotive industry is driving the demand for pearlescent pigment.
- The booming cosmetic industry is fueling the industry growth.
- Advancements in formulation drive the reliability and appeal of product.
- High production costs and limited availability of raw materials restrain the U.S. pearlescent pigment market growth.
Strong Demand from Automotive Industry: The U.S. automotive industry is growing rapidly, driving pearlescent pigment demand. According to the International Organization for Motor Vehicle Manufacturers, in 2024, the country witnessed 1,432,615 new car registrations. American consumers value vehicle customization and premium finishes, making shimmering and color-shifting coatings highly desirable. Pearlescent pigments help car manufacturers create unique paint effects that stand out and add luxury appeal. Carmakers are increasingly using these pigments for aesthetic differentiation, driven by growing auto production and rising interest in electric and luxury vehicles. Additionally, the trend toward personalization in the aftermarket, such as custom wraps and detailing, supports further growth of the U.S. pearlescent pigment market.
Growth of Cosmetic Industry: The U.S. is one of the largest and most dynamic cosmetics markets in the world. For instance, 29% of the revenue of cosmetic brand L'Oréal comes from the American region. Pearlescent pigments are widely used in makeup products such as eyeshadow, lip gloss, foundation, and nail polish to create luminous and iridescent effects. Demand for shimmer and glow-enhancing ingredients continues to rise with growing consumer interest in high-impact visuals, influencer-driven trends, and premium product packaging. Clean beauty and “Made in USA” preferences are further fueling interest in nontoxic, skin-safe pigment options, thereby propelling the U.S. pearlescent pigment market demand.
Source: Polaris Market Research Analysis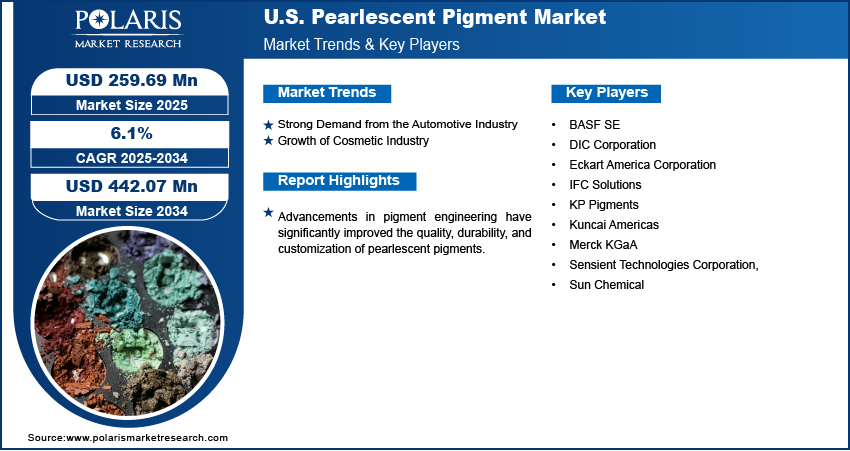
Get Full Segment-Level Forecasts & Insights: Download Sample Report
Segmental Insights
Product Analysis
The U.S. pearlescent pigment market segmentation, based on product, includes natural pearl essence, titanium dioxide mica, iron/ferric oxide mica, combination mica, and others. In 2024, the titanium dioxide mica segment dominated with the largest share due to their strong optical effects, stability, and wide applicability. These pigments offer a brilliant, high-gloss finish that is ideal for automotive paints, cosmetic formulations, and industrial coatings. Their ability to resist UV damage, chemicals, and environmental wear makes them highly reliable in diverse American industries. U.S. manufacturers prefer these pigments for consistent quality, regulatory compliance, and performance. Titanium dioxide mica pigments remain the preferred choice across major sectors such as transportation, beauty, and consumer goods, as brands continue to focus on premium product appearance and durability, thereby driving the segment growth.
The natural pearl essence segment is expected to experience significant growth during the forecast period as consumers and brands shift toward cleaner, sustainable ingredients. These pigments, derived from fish scales or natural sources, are popular in high-end beauty and personal care products for their soft, luminous glow. Many U.S. cosmetic companies are adopting these natural pigments, with American consumers increasingly demanding nontoxic and environmentally responsible formulations. Their biodegradable profile aligns with “clean beauty” trends, especially among younger, eco-conscious consumers. Natural pearl essence pigments are poised for strong growth in cosmetics and niche applications as sustainability and ethical sourcing gain traction in the U.S., thereby driving the segment growth.
Application Analysis
The U.S. pearlescent pigment market segmentation, based on application, includes paints & coatings, plastics, printing inks, cosmetics, and others. In 2024, the paints & coatings segment dominated with the largest share as these pigments are widely used in the automotive, construction, and consumer goods sectors to improve surface aesthetics and provide protective finishes. U.S. automakers rely on pearlescent paints for their luxurious, eye-catching effects that help vehicles stand out. Similarly, decorative paints for homes and commercial spaces use pearlescent pigments to create unique visual textures and finishes. The versatility of these pigments across water-based, solvent-based, and powder coatings supports widespread adoption, thereby driving the segment growth.
The printing inks segment is expected to experience significant growth during the forecast period due to rising demand in packaging, branding, and promotional materials. Pearlescent pigments are increasingly used in flexible packaging, labels, and high-end printed graphics to add depth, shine, and premium appeal. These pigments help products stand out visually both in-store and online as brands invest in shelf impact and digital marketing. U.S. companies are exploring pearlescent inks in textile printing, craft markets, and digital printing technologies. This growing demand for customization, eye-catching design, and sustainable printing solutions fuels the segment growth.
Source: Polaris Market Research Analysis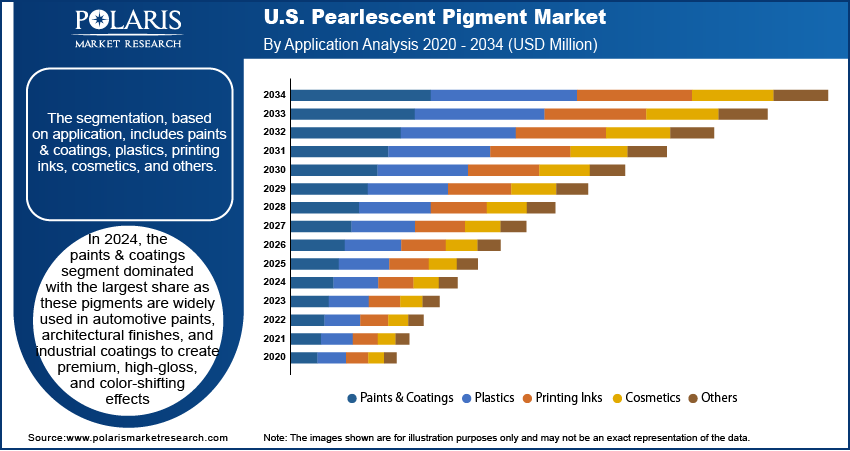
Need Granular Data Across All Market Segments? Request Customization
Key Players and Competitive Analysis
The U.S. pearlescent pigment market is highly competitive, with key players focusing on innovation, quality, and sustainability to strengthen their market presence. Major companies such as BASF SE, DIC Corporation, Eckart America Corporation, and Merck KGaA lead the market with a wide range of high-performance pigments, catering to automotive, cosmetics, coatings, and packaging applications. Sun Chemical, a major player, emphasizes sustainable solutions and digital printing innovations. Kuncai Americas and KP Pigments are expanding their U.S. footprint through customized offerings and technical support. Sensient Technologies Corporation and IFC Solutions focus heavily on the cosmetics and personal care sector with clean-label, FDA-compliant pigments. Companies are increasingly investing in R&D to develop environmentally friendly, nontoxic alternatives that meet evolving consumer and regulatory demands. Strategic partnerships, product differentiation, and advanced dispersion technologies are central to maintaining competitive advantage in this dynamic and design-driven market landscape.
Key Players
- BASF SE
- DIC Corporation
- Eckart America Corporation
- IFC Solutions
- KP Pigments
- Kuncai Americas
- Merck KGaA
- Sensient Technologies Corporation,
- Sun Chemical
U.S. Pearlescent Pigment Industry Development
In October 2024, Sun Chemical launched its Xennia Pearl pigment inks during Innovate 2021, targeting sustainable digital textile printing. The inks delivered high fastness, multi-substrate compatibility, and reduced water usage, reinforcing Sun Chemical’s commitment to eco-friendly fashion and home décor solutions.
U.S. Pearlescent Pigment Market Segmentation
By Product Outlook (Revenue, USD Million, 2020–2034)
- Natural Pearl Essence
- Titanium Dioxide Mica
- Iron/Ferric Oxide Mica
- Combination Mica
- Others
By Application Outlook (Revenue, USD Million, 2020–2034)
- Paints & Coatings
- Plastics
- Printing Inks
- Cosmetics
- Others
U.S. Pearlescent Pigment Market Report Scope
| Report Attributes | Details |
| Market Size in 2024 | USD 245.13 Million |
| Market Size in 2025 | USD 259.69 Million |
| Revenue Forecast by 2034 | USD 442.07 Million |
| CAGR | 6.1% from 2025 to 2034 |
| Base Year | 2024 |
| Historical Data | 2020–2023 |
| Forecast Period | 2025–2034 |
| Quantitative Units | Revenue in USD Million and CAGR from 2025 to 2034 |
| Report Coverage | Revenue Forecast, Competitive Landscape, Growth Factors, and Industry Trends |
| Segments Covered |
|
| Competitive Landscape |
|
| Report Format |
|
| Customization | Report customization as per your requirements with respect to countries, regions, and segmentation. |
Source: Polaris Market Research Analysis
U.S. Pearlescent Pigment Market FAQ's
The U.S. market size was valued at USD 245.13 million in 2024 and is projected to grow to USD 442.07 million by 2034.
The U.S. market is projected to register a CAGR of 6.1% during the forecast period.
A few of the key players in the market are Sensient Technologies Corporation, BASF SE, Eckart GmbH, IFC Solutions, Kuncai Americas, Merck KGaA, KP Pigments, Sun Chemical, and DIC Corporation.
The titanium dioxide mica dominated the market share in 2024.
The printing ink segment is expected to witness the significant growth during the forecast period.
Download Sample Report of U.S. Pearlescent Pigment Market
Please fill out the form to request a customized copy of the research report.
