
U.S. Protein Bar Market Size, Share, Analysis Report, 2026-2034
REPORT DETAILS
Market Statistics
What is the Current Market Size?
The U.S. protein bar market was valued at USD 1.98 billion in 2025 and is expected to grow at a CAGR of 6.80% during the forecast period. The U.S. presents promising growth opportunities with the rising popularity of fitness enthusiasts, gyms, fitness training centers, and health clubs. The evolving fitness trend in the region is expected to stimulate growth in related markets, particularly the protein bar market.
Market Statistics
- 2025 Market Size: USD 1.98 billion
- 2034 Projected Market Size: USD 3.58 billion
- CAGR (2026-2034): 6.80%
The endorsement of protein bars by fitness clubs as a meal substitute has significantly increased product sales. The United States has witnessed a notable surge in consumers embracing fitness and health clubs, making them the primary target market. With the growing number of health clubs and heightened awareness about protein bars, the market is projected to experience increased demand in the forecast period.
Source: Polaris Market Research Analysis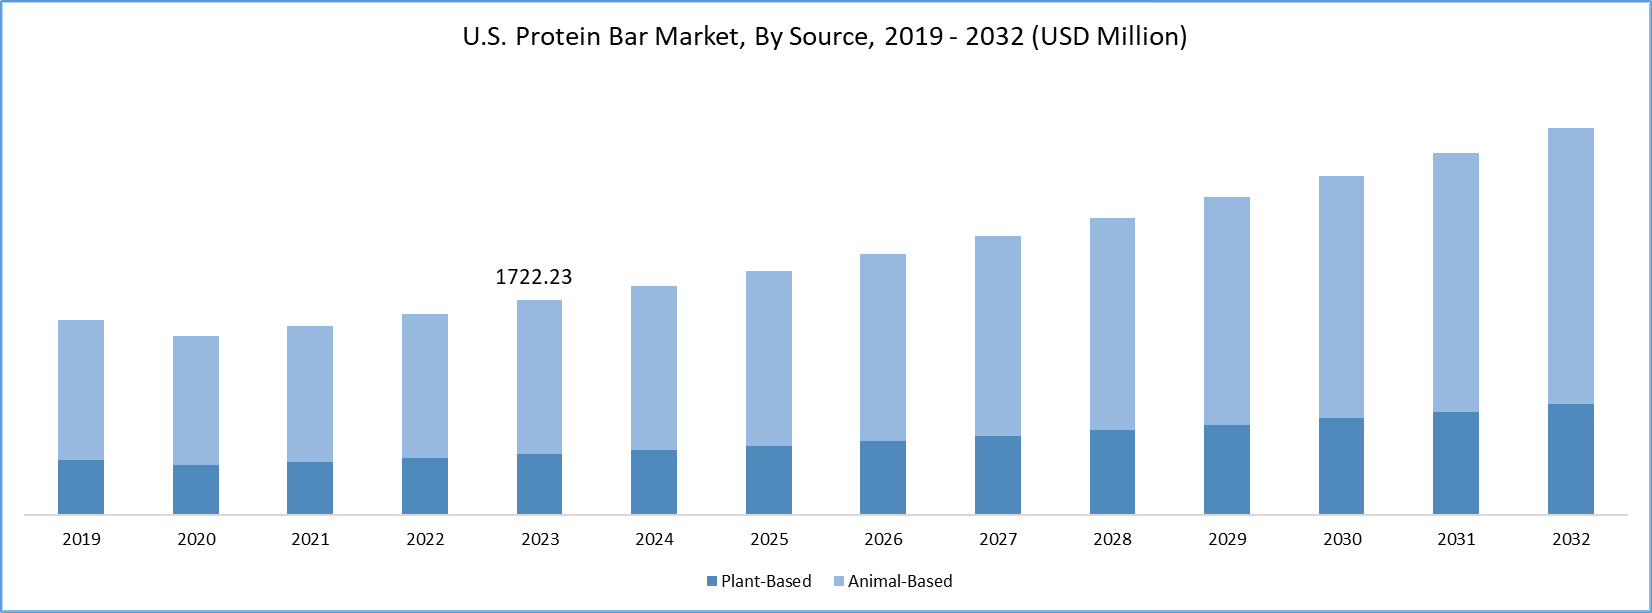
To Understand More About this Research: Download Sample Report
For instance, according to research from the IHRSA global health and fitness association in 2022, there are 31,028 health clubs in the United States. Given the importance of Protein in supporting fitness goals, consumers are turning to weight management and energy products, such as protein bars, to maintain their overall health and fitness.
Protein bars are gaining popularity among health-conscious consumers due to their high nutritional content. Incorporating these bars into meals is expected to enhance protein intake without a significant increase in calories or carbohydrates. With Americans important active lifestyles and facing demanding work schedules, there is a growing market demand for healthier options. Consequently, consumers are shifting towards snack bars, particularly protein bars, as alternatives to traditional snacks.
Additionally, the surge in popularity of protein-enriched bars is linked to the culture of between-meal snacking prevalent in the region. Consumers are in search of nutritious and convenient food options that can serve as quick, on-the-go meals. According to the International Food Information Council's (IFIC) 2020 Food and Health Survey, about 90% of Americans reported snacking at least once a week.
Source: Polaris Market Research Analysis
Get Full Segment-Level Forecasts & Insights: Download Sample Report
Growth Drivers
-
Rising Vegan Population
Protein bars crafted from plant-based sources like soy, pea, and rice protein are gaining popularity among consumers seeking vegan-friendly protein options. These bars are exclusively made from organic ingredients, including fruits, nuts, seeds, and more, offering a nutrient-rich composition that helps fortify the body against various diseases. The growing global preference for plant-based diets, driven by a desire for a healthier lifestyle, contributes to the increasing number of vegetarians, due to a surge in the consumption of plant-based protein bars, which drive the market.
The plant-based bars market is expanding further due to the diverse array of flavors now available. With a wide selection of ingredients and flavors, individuals can find plant-based bars that align with their taste preferences and dietary requirements. Additionally, the escalating concern for sustainability and the environment is playing a pivotal role in market growth. Many consumers are becoming more mindful of the ecological impact of their food choices. They are choosing plant-based alternatives that are not only more sustainable but also more eco-friendly compared to traditional animal-based products.
For instance, in July 2021, RXBAR introduced a line of protein bars featuring plant-based protein sourced from peas and nuts. These bars are vegan-friendly and come in four distinct flavors, showcasing the industry's response to the growing demand for sustainable and plant-based protein options.
Furthermore, the Veganuary campaign serves as a notable indicator and driver of the rising vegan population, contributing significantly to the growth of the protein bar market. Veganuary is an annual campaign that encourages people worldwide to try a vegan lifestyle. For instance, according to the International Vegan Union, the widespread adoption of vegan diets and plant-based alternatives, including plant-based cheese, is both evident and substantial. This article aims to explore the data underpinning this burgeoning trend, offering a comprehensive examination of the protein bar market's ascent in the United States.
According to data from the Vegan Society, the year 2022 saw a remarkable participation of over 629,000 individuals from 228 countries and territories joining the Veganuary campaign. This initiative encourages people to embrace a vegan lifestyle throughout the entire month of January. Comparatively, in 2021, there were 582,000 participants, followed by 400,000 in 2020, 250,000 in 2019, 168,500 in 2018, 59,500 in 2017, 12,800 in 2016, and 3,300 in 2015. These figures vividly illustrate the escalating global interest and participation in the movement toward plant-based living.
FDA & FTC Regulatory Landscape for Product Claims
| Aspect | FDA (labels & labeling) | FTC (advertising & promotion) |
| Scope | Regulates Nutrition Facts, ingredients, and all label claims for conventional foods, including protein bars, under 21 CFR 101. | Regulates all ads (digital, print, social, influencers) for foods and health products, ensuring they are truthful and not misleading. |
| Protein / nutrient content claims | Only allowed if criteria in 21 CFR 101.13 and Subpart D are met. Protein content and percent Daily Value must be calculated using methods in 21 CFR 101.9(c)(7); compliance for protein claims is determined with these analytical methods. Definitions such as “good source” (10–19% DV per serving) and “high” (≥20% DV) apply to protein bars. | Ads repeating these claims must match the labeled amounts and not exaggerate or imply more protein than is present. |
| Health / structure‑function claims | Allows nutrition‑based structure/function claims (e.g., “protein helps build muscle”) but prohibits disease‑treatment or risk‑reduction claims without FDA‑authorized health claims. | Requires “competent and reliable scientific evidence” (often human clinical trials) to substantiate any health or performance claims. |
| “Healthy” and front‑of‑pack | Updated “healthy” definition tightens nutrient criteria; front‑of‑pack schemes must align with FDA rules. | Treats “healthy” and icons used in marketing as implied health claims that must be adequately substantiated and non‑deceptive. |
Source: Polaris Market Research Analysis
Report Segmentation
The market is primarily segmented based on type, source.
| By Source | By Type |
|
|
Source: Polaris Market Research Analysis
Source: Polaris Market Research Analysis
Need Granular Data Across All Market Segments? Request Customization
By Source Analysis
-
Animal based source segment held the largest market share in 2025
Animal-based protein bars often appeal to consumers due to their taste and texture. Whey protein, derived from milk, is known for its smooth texture and pleasant taste, contributing to the overall palatability of the bars. The easy accessibility of animal protein sources plays a pivotal role in driving segmental growth. The global increase in health and nutrition awareness has led people to prioritize meeting their daily protein requirements, recognizing its significance in bodily functions.
Consequently, there is a growing inclination toward animal-based protein supplements to fulfill these requirements, contributing to the rising demand for such supplements. Post-pandemic, 70% of Indians expressed a commitment to dietary changes for overall health improvement, further fueling the demand for animal-based protein supplements among health-conscious consumers. Additionally, the animal-based protein supplement market is witnessing a prominent trend of product innovations. Key players in this market are actively engaged in developing new technological solutions to enhance their market positions.
For instance, in 2021, GoodSport Nutrition, a US-based company specializing in healthy sports drinks, introduced the GoodSport sports drink. This innovative beverage, comprising 97% dairy, stands out as a natural sports drink, offering three times more electrolytes and 33% less sugar compared to conventional sports drinks.
By Type Analysis
-
The Sports Nutrition Bars segment acquired highest market share over the forecast period
The increasing popularity of the "healthy" lifestyle motivates individuals to choose vegan or vegetarian products, including snacks, meals, or occasional drinks, owing to their numerous health benefits. Additionally, in pursuit of an active lifestyle, gym-goers and athletes are increasingly embracing vegan products like plant-based energy or protein bars before and after their workout routines, contributing to the burgeoning growth of the global sports market.
The growing awareness of the importance of nutrition in supporting fitness goals has led to an increased demand for sports nutrition products, including protein bars. Optimal health is a fundamental prerequisite for important a fulfilling life, highlighting the undeniable connection between nutrition, lifestyle, and sports. The intertwined relationship between food and health, viewed as a form of "medicine," serves as a potent and straightforward tool for enhancing individual well-being, particularly for athletes. Although the association of veganism with sports dates back to ancient times, there has been a notable surge in its acceptance in recent years.
Key Market Players & Competitive Insights
The U.S. Protein Bar market is characterized by intense competition, with numerous manufacturers holding a significant portion of the market share. Key business strategies employed by market participants to sustain and expand their global presence include product launches, approvals, strategic acquisitions, and innovations.
Some of the major players operating in the market include:
- Amway
- General Mills Inc.
- Glanbia plc
- GNC Holding
- Hormel Foods
- Kellogg Company
- Mars Incorporated
- Mondelez International
- Nestlé S.A.
- Simply Good Foods
Recent Developments
- In August 2025, Indian protein bar brand Phab launched Bhel Bars, a savory protein bar made with clean plant protein. Available in The OG Bhel, Curry Leaf Podi, and Peri Peri variants, the product expands options beyond sweet protein snacks.
- In September 2023: Mondelēz-owned Grenade introduced Grenade Oreo White protein bar, a collaboration with Oreo, featuring 20g protein, less than 2g sugar, and white chocolate layer.
- In May 2023: General Mills expanded Nature Valley with Savory Nut Crunch Bars, the brand's first savory snack, featuring flavors like everything bagel and white cheddar.
- In August 2023: Mars expanded its protein product range by introducing Snickers Hi Protein Low Sugar bars, aiming to boost Snickers' presence in the UK protein bar market.
US Protein Bar Market Report Scope
| Report Attributes | Details |
| Market size value in 2025 | USD 1.98 billion |
| Market size value in 2026 | USD 2.11 billion |
| Revenue forecast in 2034 | USD 3.58 billion |
| CAGR | 6.80% from 2026– 2034 |
| Base year | 2025 |
| Historical data | 2021 – 2024 |
| Forecast period | 2026 – 2034 |
| Quantitative units | Revenue in USD billion and CAGR from 2026 to 2034 |
| Segments covered | By Type, By Source |
| Customization | Report customization as per your requirements with respect to countries, region, and segmentation. |
Source: Polaris Market Research Analysis
U.S. Protein Bar Market FAQ's
The U.S. Protein Bar Market report covering key segments are type, source.
U.S. Protein Bar Market Size Worth USD 3.58 Million By 2034.
The U.S. protein bar market is expected to grow at a CAGR of 6.80% during the forecast period.
key companies in U.S. Protein Bar Market are General Mills Inc., Simply Good Foods, Kellogg Company, Nestlé S.A, GNC Holding, Glanbia plc
key driving factors in U.S. Protein Bar Market are Rising Inclination toward Fitness and Protein Diet to drive market growth
Download Sample Report of U.S. Protein Bar Market
Please fill out the form to request a customized copy of the research report.
