
U.S. Smart Meter Market Opportunity, Industry Growth, 2025-2034
REPORT DETAILS
Market Statistics
Market Overview
The US smart meter market size was valued at USD 3.93 billion in 2024, growing at a CAGR of 7.2% from 2025–2034. Supportive regulatory frameworks boosting utility investment coupled with electric vehicle expansion in the US is propelling the market growth.
Smart meters are becoming integral to US energy policy as they enable real-time monitoring, dynamic pricing, and improved outage management. Growing adoption of smart meters in water and gas metering systems is expanding application beyond electricity, strengthening their role across multiple utility sectors. Smart meters are electronic measurement devices that record energy, water, or gas consumption in real-time and transmit the data securely to utility providers for monitoring, billing, and demand forecasting. These systems support two-way communication between the meter and the utility provider, enabling remote meter reading, automated billing, outage detection, and load balancing. Eliminating the need for manual readings allows smart meters to lower operational costs, enhance billing precision, and support more effective resource planning. Expanding deployment aligns with the modernization of the power grid and rising adoption of distributed energy resources (DERs) such as rooftop solar panels and electric vehicles, which demand dynamic load management.
Smart meters are widely adopted in residential, commercial, and industrial sectors across the country. Rising electrification, ongoing utility reform, and federal funding under programs such as the Infrastructure Investment and Jobs Act (IIJA) continue to provide a strong policy framework for smart meter adoption. States such as California, Texas, and New York are leading the way in terms of deployment scale and policy integration. Ongoing improvements in data analytics and cybersecurity are positioning smart meters as a core component in the evolution of intelligent energy infrastructure across the US.
Source: Polaris Market Research Analysis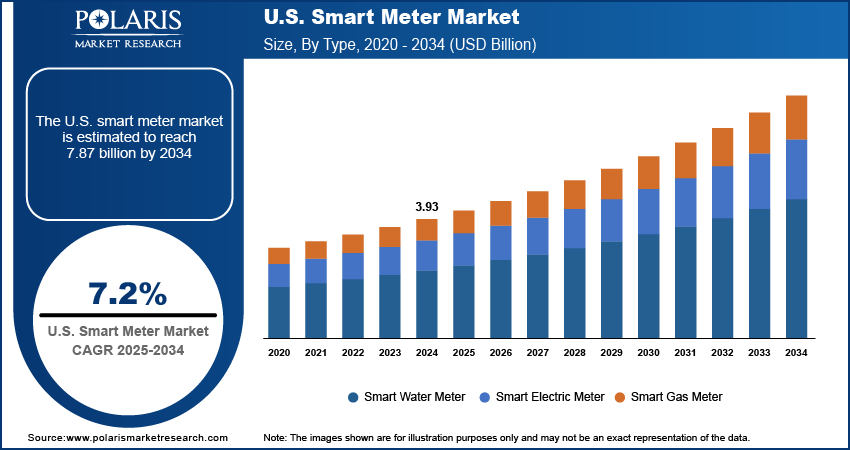
To Understand More About this Research: Download Sample Report
The rising public sector investments in grid modernization are driving the deployment of smart meters across the US. For instance, the Bipartisan Infrastructure Law, passed in 2021, allocated USD 973 billion to spent by 2026 to improve the country’s infrastructure. A major part of this funding is aimed at modernizing the power grid and supporting the use of renewable energy. These investments are accelerating the replacement of analog meters with advanced smart meter systems across major utility providers. Many state-level energy commissions are mandating utilities to adopt digital metering for improved outage detection, peak load forecasting, and regulatory compliance, further boosting the market growth. In addition, energy providers in states such as California, Illinois, and New York are introducing mandatory smart meter rollouts as part of clean energy transition goals.
The integration of advanced data analytics coupled with IoT connectivity is transforming smart meters into intelligent nodes within the broader digital infrastructure of the U.S. energy grid. Utilities are leveraging this combination to enable real-time consumption monitoring, predictive maintenance, automated fault detection, and dynamic demand-response strategies. Smart meters generate detailed usage data, boosting the deployment of AI-powered platforms and edge computing technologies to process this information quickly. This enables more responsive and self-optimizing behavior across the power grid.
Industry Dynamics
Supportive Regulatory Frameworks Boosting Utility Investment
Favorable regulatory environment across multiple US states is significantly contributing to the expansion of smart metering infrastructure. Public Utility Commissions (PUCs) in key states such as California, Texas, and Illinois approved large-scale smart meter deployment plans proposed by utilities, allowing cost recovery through rate adjustments and incentive-based mechanisms. These approvals are pushing energy providers to allocate higher capital expenditure toward advanced metering infrastructure (AMI). As per the latest data from the U.S. Energy Information Administration, electric utilities in the country reported approximately 119 million advanced metering infrastructure (AMI) installations in 2022, representing around 72% of all electric meters. Residential users made up about 88% of these AMI deployments, with roughly 73% of total residential electric meters classified as smart meters. These regulatory measures are designed to meet with federal energy modernization goals and support the shift toward real-time consumption tracking and efficient demand-side management.
Incentives for smart meter rollouts are further strengthened by multi-year rate case approvals and performance-based regulatory models, allowing utilities to recover investments while demonstrating measurable customer benefits. Capital planning that reflects regulatory requirements is enabling energy companies to develop long-term strategic roadmaps focused on the adoption of smart metering technologies.
Electric Vehicle Expansion Driving Demand for Smart Metering Infrastructure
The growing adoption of electric vehicles (EVs) across the US is accelerating the need for intelligent metering solutions that support higher electricity demand and grid reliability, thus accelerating the market growth. According to the International Energy Agency report, electric vehicle sales in the U.S. increased from 0.8 million units in 2022 to 1.2 million units in 2024. This rapid growth is reshaping energy consumption patterns, particularly in residential neighborhoods where overnight EV charging significantly affects load distribution. Smart meters are essential in managing this shift by enabling real-time monitoring of household electricity usage, facilitating dynamic pricing models, and integrating EV charging data with home energy management systems.
Utilities are increasingly relying on smart metering infrastructure to implement demand response strategies that help balance peak loads caused by EV charging. Smart meters also support the development of V2G (vehicle-to-grid) programs, where stored energy from EVs are used to stabilize the grid during periods of high demand. The expanding EV ecosystem is propelling strong demand for AMI solutions that support flexible and efficient electricity delivery, boosting smart meter adoption across the country.
Source: Polaris Market Research Analysis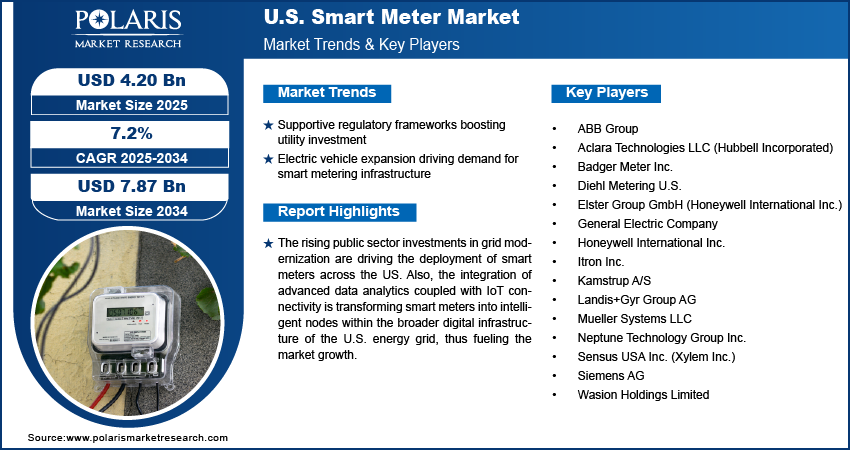
Get Full Segment-Level Forecasts & Insights: Download Sample Report
Segmental Insights
Component Analysis
The segmentation, based on component includes, hardware and software. The hardware segment dominated the market in 2024, owing to widespread investments in physical smart metering devices deployed across residential, commercial, and industrial premises. Utility providers are actively upgrading legacy analog systems with digital meters equipped with real-time data transmission capabilities and built-in communication modules. The growing number of pilot and full-scale rollouts across multiple US states are contributing to a steady increase in the installed base of smart meters, particularly in electric and water utility segments.
The software segment is projected to be the fastest-growing during the forecast period, supported by increasing demand for advanced analytics platforms, grid visualization dashboards, and remote monitoring systems. Smart meters generate large volumes of usage and diagnostic data, pushing utilities to adopt cloud-based and AI-driven software for extracting insights, optimizing energy distribution, and enhancing customer engagement. For instance, Southern California Edison (SCE) introduced the AI-powered AWARE platform in early 2023 to monitor real-time data from substations, AMI, and SCADA systems. The system flagged over 255 potential failures in advance, helping reduce outage restoration times by up to 30% and enhancing safety and customer satisfaction. Features such as consumption forecasting, outage management, and fraud detection are enhancing the importance of software tools within the smart metering ecosystem. Furthermore, software upgrades extend meter functionality and allow compliance with evolving regulatory frameworks, further accelerating the market growth.
Type Analysis
The segmentation, based on type includes, smart electric meter, smart water meter, and smart gas meter. The smart electric meter segment dominated the revenue share in 2024. This growth is due to the strong federal and state initiatives focused on electric grid modernization. High electricity consumption in residential and commercial sectors, combined with the proliferation of distributed energy resources (DERs), increased the need for precise real-time monitoring and two-way communication. Major utilities such as Duke Energy, Pacific Gas & Electric, and Con Edison initiated or expanded electric smart meter deployments to meet regulatory compliance and performance metrics. These meters enable time-of-use billing, outage detection, and voltage optimization, strengthening their adoption across service areas.
The smart water meter segment is anticipated to grow at the fastest rate through 2034, fueled by increasing pressure on utilities to improve water conservation, reduce non-revenue water loss, and enhance billing accuracy. Many municipalities and regional water authorities in the US are shifting toward AMI-based smart water metering solutions to enable remote leak detection, continuous monitoring, and better demand forecasting. Federal infrastructure funding and rising concerns around drought and aging water infrastructure in regions such as the Southwest are further propelling investment in digital water metering technologies.
Technology Analysis
The segmentation, based on technology includes, automatic meter reading (AMR) and advanced meter infrastructure (AMI). The advanced metering infrastructure (AMI) segment accounted for largest revenue share in 2024, due to its ability to support two-way communication, dynamic pricing, and advanced grid management features. AMI technologies are critical for modern grid operations, offering enhanced functionalities such as remote disconnection, fault localization, and automated data collection. Utilities adopting AMI platforms are better equipped to respond to regulatory pressures and customer expectations around energy transparency. The US Department of Energy’s Smart Grid Investment Grant (SGIG) and recent allocations under the Infrastructure Investment and Jobs Act (IIJA) accelerated AMI adoption across major urban and suburban areas.
The automatic meter reading (AMR) segment is projected to record moderate growth, while still serving as a transitional technology for utilities upgrading legacy systems. AMR solutions are widely used for unidirectional communication and automated data logging in regions where full AMI deployment is cost-prohibitive or logistically complex. However, AMI’s broader functionality and alignment with smart grid initiatives are significantly driving its adoption.
End Use Analysis
The segmentation, based on end use includes, residential, commercial, and industrial. The residential segment dominated the market is expected to witness significant growth during the forecast period. This growth is attributed to mass deployment of smart meters by electric, gas, and water utilities serving households across the US. Rising consumer awareness, demand for detailed consumption insights, and the push for demand-side energy efficiency are further fueling the demand in residential settings. Utilities are offering homeowners access to web portals and mobile apps that display real-time usage data, billing history, and personalized recommendations. Additionally, federal and state policies mandating the use of smart meters in new housing developments are pushing the segment dominance.
The commercial segment is projected to be the fastest-growing over the forecast period, driven by rising demand for consumption visibility, cost management, and sustainability tracking across business and institutional buildings. Hotels, hospitals, retail centers, and office complexes are increasingly adopting smart metering to monitor usage patterns, identify inefficiencies, and participate in energy-saving programs. Furthermore, commercial energy users are leveraging advanced metering data to meet with ESG reporting requirements and green building certifications, such as LEED and ENERGY STAR. This growing need for accountability and performance optimization is propelling commercial adoption of smart metering solutions.
Source: Polaris Market Research Analysis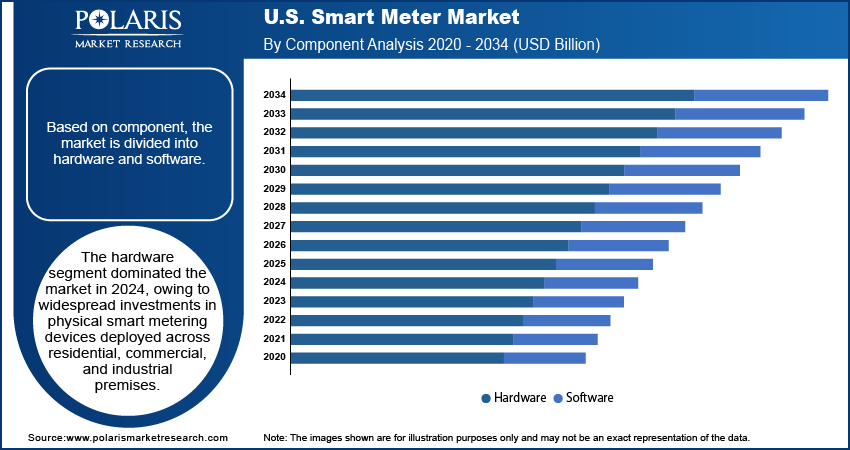
Need Granular Data Across All Market Segments? Request Customization
Key Players & Competitive Analysis Report
The U.S. smart meter market is characterized by intense competition among major players focusing on innovation, strategic partnerships, and infrastructure expansion to strengthen their presence across electric, water, and gas utility segments. Companies are consistently investing in R&D to develop advanced metering infrastructure (AMI) solutions that offer greater interoperability, cybersecurity, and data analytics capabilities. As utilities transition to smart grid models, vendors are introducing modular and scalable metering platforms integrated with AI, edge computing, and IoT technologies. The competitive landscape is further shaped by collaborations with regional utility providers to support pilot projects, large-scale rollouts, and software integration services.
Prominent players in the U.S. smart meter market include ABB Group, Aclara Technologies LLC (Hubbell Incorporated), Badger Meter Inc., Diehl Metering U.S., Elster Group GmbH (Honeywell International Inc.), General Electric Company, Honeywell International Inc., Itron Inc., Kamstrup A/S, Landis+Gyr Group AG, Mueller Systems LLC, Neptune Technology Group Inc., Sensus USA Inc. (Xylem Inc.), Siemens AG, and Wasion Holdings Limited.
Key Players
- ABB Group
- Aclara Technologies LLC (Hubbell Incorporated)
- Badger Meter Inc.
- Diehl Metering U.S.
- Elster Group GmbH (Honeywell International Inc.)
- General Electric Company
- Honeywell International Inc.
- Itron Inc.
- Kamstrup A/S
- Landis+Gyr Group AG
- Mueller Systems LLC
- Neptune Technology Group Inc.
- Sensus USA Inc. (Xylem Inc.)
- Siemens AG
- Wasion Holdings Limited
Industry Developments
- February 2025: Landis+Gyr announced plans to divest its EMEA business and shift focus to the Americas, with a potential public listing in the United States under evaluation.
- January 2025: Eversource Energy began a three-year rollout of 1.28 million smart meters in Massachusetts after receiving USD 668 million in regulatory approval.
- May 2025: ABB Group entered into a supply frame agreement with Germany-based RMG to deliver advanced ultrasonic gas meters for the U.S. energy sector. This collaboration aims to enhance ABB’s offerings in custody transfer and midstream operations by integrating high-precision gas measurement technologies.
- November 2024: Itron and Pacific Gas and Electric launched a pilot using Grid Edge Intelligence to manage residential EV charging without requiring panel upgrades.
- October 2024: Diehl Metering expanded production of its HYDRUS 2.0 ultrasonic smart water meters to better serve the U.S. market. The move addresses key regional concerns such as water conservation, system maintenance efficiency, and minimizing Non-Revenue Water.
- December 2023: Xylem Inc., through its subsidiary Sensus USA Inc., launched the Stratus IQ+ smart meter in the U.S. This meter features edge computing to detect EV charging activity and supports utilities with real-time analytics for load planning and demand management amid increasing EV adoption.
US Smart Meter Market Segmentation
By Component Outlook (Revenue, USD Billion, 2020–2034)
- Hardware
- Software
By Type Outlook (Revenue, USD Billion, 2020–2034)
- Smart Electric Meter
- Smart Water Meter
- Smart Gas Meter
By Technology Outlook (Revenue, USD Billion, 2020–2034)
- Automatic Meter Reading (AMR)
- Advanced Meter Infrastructure (AMI)
By End Use Outlook (Revenue, USD Billion, 2020–2034)
- Residential
- Commercial
- Industrial
US Smart Meter Market Report Scope
| Report Attributes | Details |
| Market Size in 2024 | USD 3.93 Billion |
| Market Size in 2025 | USD 4.20 Billion |
| Revenue Forecast by 2034 | USD 7.87 Billion |
| CAGR | 7.2% from 2025 to 2034 |
| Base Year | 2024 |
| Historical Data | 2020–2023 |
| Forecast Period | 2025–2034 |
| Quantitative Units | Revenue in USD Billion and CAGR from 2025 to 2034 |
| Report Coverage | Revenue Forecast, Competitive Landscape, Growth Factors, and Industry Trends |
| Segments Covered |
|
| Competitive Landscape |
|
| Report Format |
|
| Customization | Report customization as per your requirements with respect to countries, regions, and segmentation. |
Source: Polaris Market Research Analysis
U.S. Smart Meter Market FAQ's
The global market size was valued at USD 3.93 billion in 2024 and is projected to grow to USD 7.87 billion by 2034.
The US market is projected to register a CAGR of 7.2% during the forecast period.
A few of the key players in the market are ABB Group, Aclara Technologies LLC (Hubbell Incorporated), Badger Meter Inc., Diehl Metering U.S., Elster Group GmbH (Honeywell International Inc.), General Electric Company, Honeywell International Inc., Itron Inc., Kamstrup A/S, Landis+Gyr Group AG, Mueller Systems LLC.
The hardware segment dominated the market share in 2024.
The smart water meter segment is expected to witness the fastest growth during the forecast period.
Key trends include federal grid modernization funding, rapid EV adoption driving AMI demand, AI and IoT integration, expanding smart water metering, and supportive regulatory frameworks mandating utility investments in advanced metering infrastructure.
Download Sample Report of U.S. Smart Meter Market
Please fill out the form to request a customized copy of the research report.
