

What is Virtual Fitting Room Market Size?
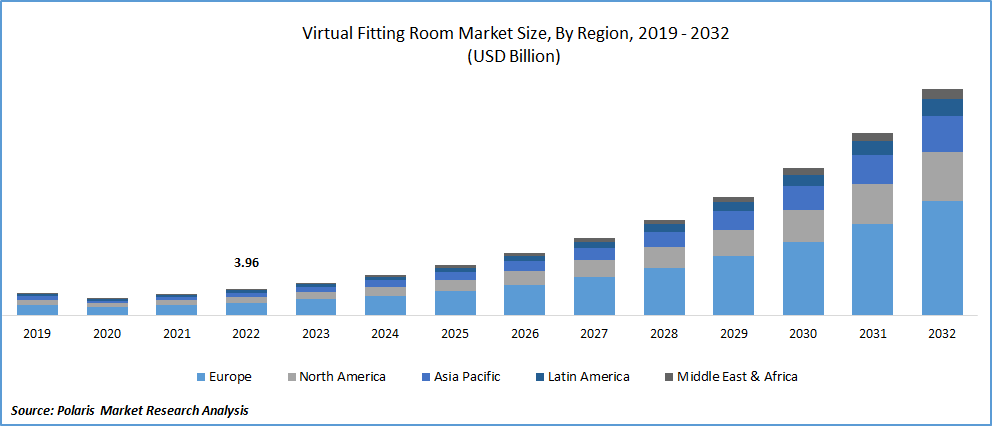
The global virtual fitting room market was valued at USD 6.05 billion in 2024 and is expected to grow at a CAGR of 24.9% during the forecast period. The growth is driven by expansion of online shopping, rising penetration of smartphones and technological advancement.
Key Insights
- The software segment dominated in 2024 due to increase in focus on targeting clients by continually advancing and innovating in the field of virtual fitting room technology.
- The beauty & cosmetics segment is expected to witness fastest growth during the forecast period due to rising popularity of e-marketplaces.
- Europe dominated with largest share in 2024 due to numerous renowned fashion brands in the region.
- Asia Pacific is projected to accounted for a significant share in the global market due to innovative and advanced solutions that facilitate prompt purchasing decisions.
Industry Dynamics
- The increasing demand for online shopping is fueling the growth.
- The rising smartphone penetration globally is driving the growth.
- The technological advancement is boosting the growth.
- The high implementation costs and complex integration with existing retail systems is limiting the growth of the industry.
Market Statistics
- 2024 Market Size: USD 6.05 Billion
- 2034 Projected Market Size: USD 55.47 Billion
- CAGR (2025-2034): 24.9%
- Largest Market: Europe
Impact of AI on Industry
- Improves personalization by analyzing user data such as body shape, size, past purchases, preferences.
- Improves fit accuracy by using machine learning models which process vast datasets of body scans and garment dimensions.
- Creates lifelike digital avatars that accurately mirror customers’ body types, enabling more realistic and confident virtual try-ons.
To Understand More About this Research: Request a Free Sample Report
These rooms act as platforms between customers & fashion brands, with the goal of boosting customer confidence and reducing return/exchange rates caused by sizing and fitting issues. The growing prevalence of intelligent technologies, including efficient lenses, smart mirrors, & smart-phone cameras, is projected to fuel the demand for such room technology in the foreseeable future.
The market for virtual fitting room solutions is projected to experience substantial growth due to the emergence of Virtual Reality (VR) and augmented Reality (AR) technology. These technologies offer improved realism and immersion, leading to an enhanced user experience. Many companies are actively exploring the integration of VR shopping experiences into their physical stores and online platforms to provide customers with a more engaging purchasing journey. The accessibility of virtual fitting room experiences has been significantly enhanced through the availability of smartphone applications worldwide. Consumers now have the convenience of using their smartphones or tablets to try on clothes, making it easier for on-the-go shopping and improving the overall shopping experience. Additionally, body scanning technologies are being used to generate virtual avatars resembling their physical selves. This technological advancement is anticipated to drive market demand in the coming years. Furthermore, e-commerce retailers are increasingly integrating virtual fitting rooms into their online platforms.
Growth Drivers
What Factors are Driving the Market Growth?
The increasing demand for online clothing shopping is a pivotal driver propelling the Virtual Fitting Room Market. In recent years, e-commerce has witnessed exponential growth, revolutionizing the way consumers purchase clothing and accessories. This shift in consumer behavior has led to a corresponding need for innovative solutions that address common challenges associated with online shopping, particularly regarding size and fit. Virtual fitting rooms offer a dynamic and interactive way for consumers to try on clothing virtually, helping them make more informed purchasing decisions. This technology bridges the gap between the digital and physical shopping experiences, providing shoppers with a realistic sense of how garments will fit and look on their bodies. As consumers increasingly embrace the convenience and accessibility of online shopping, retailers and e-commerce platforms are integrating virtual fitting room solutions into their websites and apps. This trend not only enhances customer satisfaction by reducing the likelihood of returns due to sizing issues but also contributes to improved brand loyalty and increased sales, ultimately driving the growth of the virtual fitting room market.
Report Segmentation
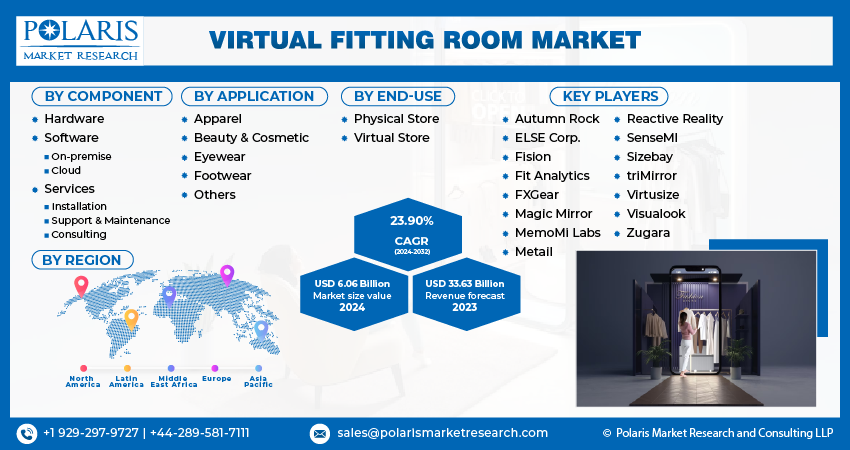
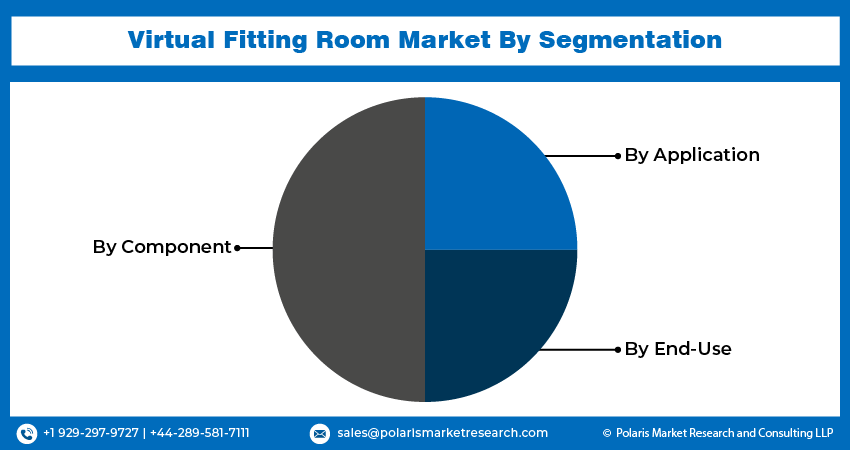
The market is primarily segmented based on component, application, end-use, and region.
|
By Component |
By Application |
By End-Use |
By Region |
|
|
|
|
To Understand the Scope of this Report: Speak to Analyst
Why Software Segment Dominated in 2024?
The software segment dominated with the largest share in 2024. Prominent industry players are directing their efforts toward targeting clients by continually advancing and innovating in the field of virtual fitting room technology. They recognize that software plays a vital role in enabling such solutions. Retailers have experienced significant revenue growth by leveraging progressive and innovative fitting room technology, underscoring the increasing demand for personalized "try-before-you-buy" software. As a result, the market is expected to witness a substantial increase in demand throughout the forecast period.
Which Segment by Application is Projected to Grow at a Healthy CAGR?
Beauty & cosmetics segment is projected to grow at a healthy CAGR. The increasing popularity of e-marketplaces has prompted well-known beauty and cosmetic brands to transition towards online product deliveries. Virtual try-on technology, which initially faced challenges in achieving widespread adoption, has recently gained momentum due to its ability to enable consumers to virtually test various looks and gather valuable data on retail brands. This trend is anticipated to drive the growth of the market in the coming years.
Regional Insight
How Europe Captured Largest Market Share in 2024?
The Europeans dominated the global market with a considerable share in 2022. This growth can be attributed to the presence of numerous renowned fashion brands in the region. The region has wide network of fashion brands such as Chanel, Gucci, and Alexander McQueen. These brands have both the brand ambition and the resources to invest in advanced digital retail technologies, which fuels the demand for virtual fitting room in the region. Furthermore, the increasing demand for improved customer buying experiences and the escalating competition among retailers have driven the adoption of innovative digital technologies, thereby driving the growth of the industry in the region.
What are the Reasons for Asia Pacific's Fastest Growth?
Asia Pacific region is expected to witness the fastest growth rate during the forecast period. The increasing demand for innovative and advanced solutions that facilitate prompt purchasing decisions is anticipated to drive the growth of the regional market. Moreover, the region holds a significant market share in the e-commerce sector, with countries such as India, China, Japan, & South Korea surpassing other regions. This strong presence in the e-commerce market is expected to propel the region’s growth prospects.

Competitive Insight
The virtual fitting room market is fragmented and is anticipated to witness competition due to several players' presence. Major service providers in the market are constantly upgrading their technologies to stay ahead of the competition and to ensure efficiency, integrity, and safety. These players focus on partnership, product upgrades, and collaboration to gain a competitive edge over their peers and capture a significant market share.
Some of the major players operating in the global market include
- Autumn Rock
- ELSE Corp.
- Fision
- Fit Analytics
- FXGear
- Magic Mirror
- MemoMi Labs
- Metail
- Reactive Reality
- SenseMI
- Sizebay
- triMirror
- Virtusize
- Visualook
- Zugara
Recent Developments
- September 2025, Wildberries, a leading Eurasian digital marketplace, launched its AI-powered virtual fitting room, allowing users to upload photos and virtually try on clothes. The feature, using computer vision and AI, enhanced online shopping convenience and boosted seller conversions.
- September 2024, Fytted, an AI-driven body measuring platform, launched its virtual fitting room app, allowing users to try on over one million items from 600+ brands like Lululemon and J.Crew. The tool enhanced fit accuracy and reduced product returns by 40%.
- March 2022, Walmart introduced a virtual try-on tool that enables customers to virtually try on clothing items using a personalized virtual model that matches their specific body type, hair color, and skin tone.
- August 2022, Be Retail Social, a platform specializing in virtual try-on & virtual fitting room solutions, unveiled its inaugural customer product, known as “Get Cutie”. This category focuses on offering vintage-inspired handmade garments. Notably, Retail Social is the first fashion retailer to utilize accelerator and extension services, enabling customers to try on the garments using an avatar virtually. This technology assists customers in making informed purchasing decisions based on their virtual try-on experience.
Virtual Fitting Room Market Report Scope
|
Report Attributes |
Details |
|
Market size in 2024 |
USD 6.05 billion |
| Market size in 2025 | USD 7.52 billion |
|
Revenue Forecast in 2034 |
USD 55.47 billion |
|
CAGR |
24.9% from 2025 – 2034 |
|
Base year |
2024 |
|
Historical data |
2020 – 2023 |
|
Forecast period |
2025 – 2034 |
|
Quantitative units |
Revenue in USD billion and CAGR from 2025 to 2034 |
|
Segments Covered |
By Component, By Application, By End Use, By Region |
|
Regional scope |
North America, Europe, Asia Pacific, Latin America; Middle East & Africa |
|
Customization |
Report customization as per your requirements with respect to countries, regions, and segmentation. |
FAQ's
The global virtual fitting room market size is expected to reach USD 55.47 billion by 2034.
Key players in the market are Autumn Rock, ELSE Corp., FXGear, Metail, Fit Analytics.
The Europe Region contributed notably in the market
The global virtual fitting room market is expected to grow at a CAGR of 24.9% during the forecast period.
The virtual fitting room market report covering key segments are component, application, end-use, and region.
Page last updated on:
Oct-2023
Research Methodology
A robust system of research, verification, and forecasting designed to ensure reliable and actionable market insights.
Polaris Market Research uses a clear and structured approach to deliver insights that clients can rely on. The process combines detailed primary and secondary research, including direct communication with industry experts. The detailed information helps build a complete picture of market trends and developments. Secondary data is gathered from credible sources such as industry reports, company filings, government source links, and trusted organization databases. It is then cross-checked through discussions with key stakeholders across the value chain. Market size and forecasts are developed using both bottom-up and top-down methods to ensure accuracy and consistency in the final results.

Project Setup
Step 1 & 2:
- We start every project by clearly understanding the client’s objective or goal, then defining the market scope, and aligning regions, segments, and timelines.
- Once the foundation is set, we collect data from all-around of sources, including company reports, government databases, and paid industry platforms.
- Our research is based on secondary data, which helps us build a strong understanding of the market across regions and industries. Then we validate this information through primary research by speaking directly with industry experts, companies, and stakeholders.
- By combining secondary and primary research, we ensure that our market insights are accurate, practical, and closely aligned with real market conditions.
Data Collection
We gather information from both public and verified sources:

Data Structuring
Step 3:
- All collected data is organized into a consistent format to ensure accurate analysis. Since inputs come from multiple sources, they are standardized and aligned before use.
- The data is segmented by product, application, and region, and mapped across a defined historical period (2020–2024). All values are converted into common units (USD Mn/Bn), and volume and pricing are aligned where required to estimate revenue.
- Any overlaps or inconsistencies are reviewed and adjusted to maintain accuracy (<5% variance threshold).
- The result is a structured dataset that allows for clear comparison across regions and supports reliable analysis and forecasting.
Structured Market Dataset, USD Mn/Bn

4. Data Structuring
Step 4: TOP-DOWN APPROACH
- We start with the overall market size at a global or macro level.
- The market is then narrowed down based on scope and industry relevance.
- We apply penetration rates and split the data by region and segment.
- This helps us estimate the market size for specific segments.
- The numbers are validated through cross-checks to ensure accuracy.

Step 5: BOTTOM-UP APPROACH
- We begin by analyzing data from leading companies in the market.
- Revenue data is collected and mapped across different segments.
- The data is then aggregated to estimate the total market size.
- To fill in any gaps, adjustments are made based on industry standards.
- Validation checks make sure that the results are correct.

5. Data Structuring
Step 6:
At Polaris Market Research, we employ a methodical forecasting strategy. This approach blends the analysis of historical data with real-time market validation. To forecast future trends with precision, we examine past patterns, pricing fluctuations, and the interplay of supply and demand. To ensure our conclusions reflect the present market landscape, we actively seek input from industry experts and key stakeholders.
To refine our predictions, we carefully consider critical elements such as market drivers and restraints, fluctuations in raw material costs, emerging technologies, and the production capabilities of various regions. Furthermore, we assess regulatory frameworks and potential policy shifts to gauge their potential impact on market expansion.
All this information is synthesized to generate precise forecasts for each segment and region. These forecasts illuminate the current state of the market and highlight forthcoming opportunities.

6. Data Structuring
Step 7:
In the final stage, we validate all our estimates using a triangulation method, where data is cross-checked from multiple reliable sources, like company data, primary interviews, and secondary research. This helps us make sure that our numbers are correct and fit with the rest of the market.
This process involves verifying data consistency across various segments and geographic areas. It also requires comparing historical trends with the assumptions support the forecast. Any discrepancies involve adjustments to ensure everything remains aligned and dependable.
Once the data is finalized, we prepare the final outputs, including market size estimates, segment-wise breakdowns, and growth metrics. These are delivered in structured formats such as tables, charts, and data files for easy analysis and use.
We collaborate closely with clients, ensuring the final products align with their requirements. This includes offering tailored adjustments, supplementary data analyses, and continuous assistance. Furthermore, we monitor market trends post-delivery, providing updates and refinements to maintain the insights' relevance as time passes.
Post-delivery, we continue to monitor market shifts, offering updates and adjustments to ensure the insights remain relevant over time.
Validation
Triangulation Framework
- Company-level data
- Primary inputs from industry participants
- Secondary benchmarks and published data
- Variance maintained within ±5-10%
- Adjustments applied to align estimates
- Segment values validated against overall market structure
Quality Check
Data Consistency & Integrity
- Segment totals validated to 100%
- Regional estimates aligned with global market size
- Historical trends compared against forecast outputs
- Assumptions reviewed for cross-segment and regional alignment
Output & Delivery
Final Outputs
- Market size estimates (USD Mn/Bn)
- Segment-wise distribution (%)
- Growth metrics (CAGR %)
- Structured tables and charts
- Segment-level datasets
- Excel-based data files for further analysis
Client Alignment & Support
- Deliverables are aligned with defined client requirements and scope
- Custom data cuts and segment splits are incorporated as required
- Post-delivery queries are addressed through analyst interactions
- Additional clarifications and data support are provided upon request
Client Continuity & Updates
- Market developments are tracked post-delivery to capture changes in key trends
- Updated data and revisions are provided based on new market inputs
- Additional refinements and data cuts are shared as required
- Continued analyst engagement supports evolving client requirements
