
Virtual Reality in Gaming Market Size, Share Analysis, 2026-2034
REPORT DETAILS
Market Statistics
Report Outlook
The global virtual reality (VR) in gaming market size stood at USD 37.08 billion in 2025. The market is projected to account for a CAGR of 21.4% between 2026 and 2034. VR technology uses simulation and computer modeling to develop a three-dimensional visual and sensory environment. The market is being driven by the growing adoption of VR headsets and accessories and the demand for better gaming experiences. In addition to hardware, the market is also influenced by the broader VR gaming environment. This refers to the software environment, immersive game content, social experiences, and commercial environments such as VR gaming arcades. The development of standalone devices, enhancements in wireless technology, and advancements in graphical processing are improving VR gaming experiences both at home and in commercial environments. As the VR gaming ecosystem improves with richer content and a more refined user experience, the market is likely to expand.
Key Insights
- The hardware segment led the VR in gaming market in 2025. This is because of the fundamental role hardware plays in providing the immersive experiences associated with VR in gaming.
- The individual segment is expected to experience rapid growth during the forecast period. This is due to the increasing accessibility and affordability of VR.
- North America dominated the global market in 2025. This is due to its advanced technological infrastructure and strong presence of major tech companies.
- Asia Pacific is projected to witness substantial growth during the projection period. The expanding base of avid gamers in the Asia Pacific has led to increased demand for immersive gaming experiences.
Industry Dynamics
- Immersive and realistic experience of playing games through VR is a major driver for the expansion of the market.
- Increased investments by tech and gaming companies are contributing to the growth of the market.
- The introduction of scalable, cloud-based gaming solutions is expected to create several market opportunities.
- Compatibility issues associated with VR devices may hinder the VR in gaming market growth.
Market Statistics
2025 Market Size: USD 37.08 billion
2034 Projected Market Size: USD 211.29 billion
CAGR (2026–2034): 21.4%
North America: Largest Market Share
AI Impact on VR in Gaming Market
- Artificial intelligence (AI) assists in developing virtual characters and environments that are more responsive to players. This makes the VR gaming experience more realistic.
- The systems can also be trained to learn from players and change the challenges or storylines to fit individual tastes.
- With AI technology, developers can produce more environments and characters in less time. This accelerates the production of new VR games.
- Additionally, AI technology supports voice recognition and behavior analysis, enabling players to interact with characters and objects more naturally.
Source: Polaris Market Research Analysis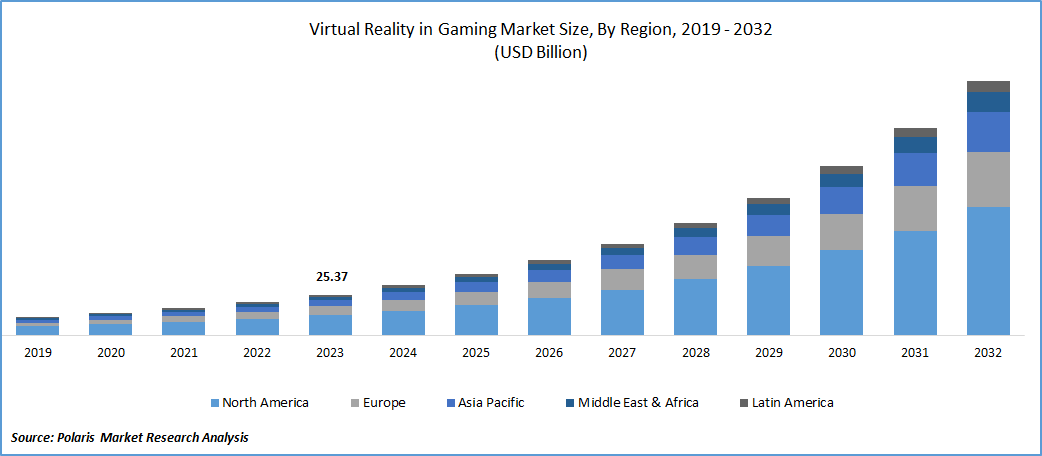
To Understand More About this Research:Download Sample Report
Investors and businesspeople are showing considerable interest in the virtual reality industry. Many tech companies are investing in immersive technology, making it a major trend in entertainment and computing. These investments are not only in hardware production but also in content production for VR gaming, developer tools, cloud delivery systems, interactive accessories, and subscription services. The increase in investments in hardware and content is helping to improve the quality of AAA VR games, increase social VR spaces, and add features to improve user experience, such as haptic feedback, eye tracking VR, and rendering.
Companies are constantly engaged in research and development activities to bring technologically advanced products to the market. In the virtual reality in gaming market, companies are developing a variety of accessories such as motion sensors, treadmills, gloves, arms, and bodysuits. The increasing demand for virtual reality (VR) accessories and wearable technology from users, along with the possibilities of reduced prices in the next couple of years, is likely to boost the virtual reality (VR) gaming market. However, the problem of compatibility issues faced by the devices may act as a barrier to the industry’s growth. Other VR gaming challenges include the high initial VR headset cost and the lack of high-quality AAA VR content in certain genres. Some people may also experience discomfort with motion simulation, and VR systems need sufficient space at home. These challenges need to be addressed to drive VR adoption forward. This may entail improving device compatibility, reducing device costs, and improving game content and usability.
Virtual Reality in Gaming Market Dynamics
Immersive and Engaging Gaming Experiences
Market CAGR is driven by the growing demand for immersive, realistic gaming experiences. With VR technology, users are placed right in the middle of the gaming environment. It makes the experience more interactive and interesting to play. Advancements in real-time rendering, AI-assisted game design, spatial audio, hand tracking, and haptic feedback devices further support this. These advancements are providing users with a better experience. Furthermore, advancements in wireless technology for VR headsets are helping users access VR gaming easily without needing high-end PC systems.
Growing User Base in Video Game Industry
The rising number of video game players is contributing to the development of virtual reality in gaming market. As the number of users who are involved in gaming increases, so does the number of users who are interested in having a more immersive experience in gaming. This is causing an increase in the consumer base for VR gaming. As the gaming community is expanding across various platforms such as consoles, PCs, and mobile devices, the VR gaming industry is growing as well. Features such as cross-platform play, user-generated content, social experiences in VR, and multiplayer are causing users to spend more time on VR games. These features are also prompting developers to create content across various genres such as action, simulation, sports, and fitness.
Rising Investment From Tech Companies And Gaming Studios
Increased financial investments from technology companies and gaming studios are helping to boost the growth of the virtual reality in gaming industry. These investments are improving the platform ecosystem through exclusive games, better controllers, better optics, eye-tracking technology, cloud-based services, and subscription-based gaming. As the major technology companies and gaming studios compete to improve the connection between hardware and software, the VR gaming industry is benefiting from the advancements in hardware and premium VR content.
Source: Polaris Market Research Analysis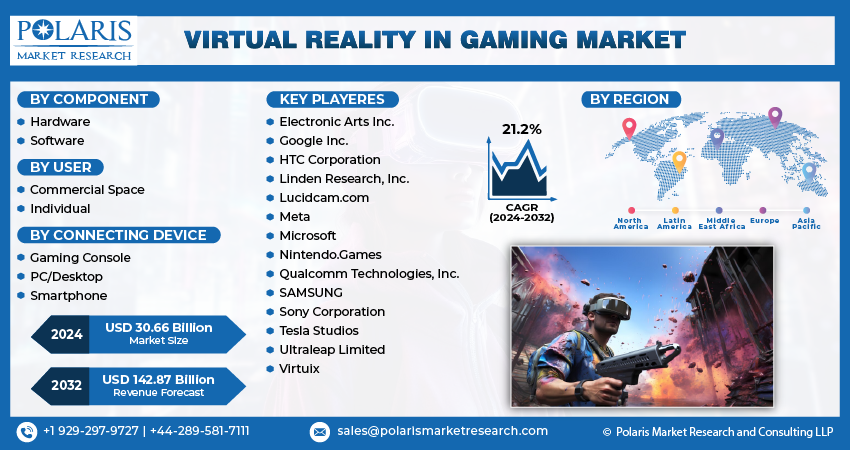
Get Full Segment-Level Forecasts & Insights: Download Sample Report
VR in Gaming Market Segment Insights
By Component Insights
The virtual reality in gaming market segmentation, based on component, includes hardware, software, and content. The hardware segment led the market in 2025. This is due to its importance in enabling immersive experiences in virtual reality gaming. VR hardware comprises a range of devices, such as headsets, controllers, motion sensors, and haptic devices. These devices are essential for creating a realistic gaming environment. The constant enhancement of VR hardware, such as resolution, field of view, and tracking capabilities, is contributing to a better gaming experience. These improvements are making VR gaming more appealing to users. For example, in May 2024, Rain Technology announced its plans to launch advancements in its patented optical engine for augmented reality and VR headsets under its Anamorphic-XR product line. The technology makes advanced directional display capabilities for AR/VR devices possible. Consequently, the launch of improved VR headsets is contributing to the continued dominance of the hardware segment in the market.
The software segment is expected to grow faster. This is because developers are focusing more on VR game engines, live service VR games, social features, adaptive gameplay development, and content optimization tools.
By User Insights
Based on user, the market is segmented into commercial space and individual. The individual user segment is expected to grow significantly. This is because of increased accessibility and affordability. As VR technology becomes more affordable and accessible, individual consumers are purchasing personal VR technology for individual use at home. In addition, there is diversity in VR gaming, ranging from low-immersive content to high-immersive interactive content, making it easy to appeal to individual consumers with diverse interests and preferences. The evolution of VR technology, in terms of graphical quality and motion tracking, provides a more pleasant experience for individual VR gamers. For instance, in January 2024, Pimax announced its 60G AirLink wireless module in conjunction with its flagship product, Pimax Crystal. With its 60G AirLink module and its built-in eye-tracking technology, users were able to experience UHD (Ultra High Definition) VR wirelessly. These advancements in VR technology boost the individual user segment.
The commercial segment is a significant source of virtual reality in gaming market demand. It includes VR arcades, gaming lounges, and location-based entertainment venues. These venues give consumers a chance to experience premium VR content that may be too expensive for a home environment. It offers a way of educating consumers about the availability of VR gaming. It generates repeat business, especially for consumers in urban areas who are looking for social environments.
Source: Polaris Market Research Analysis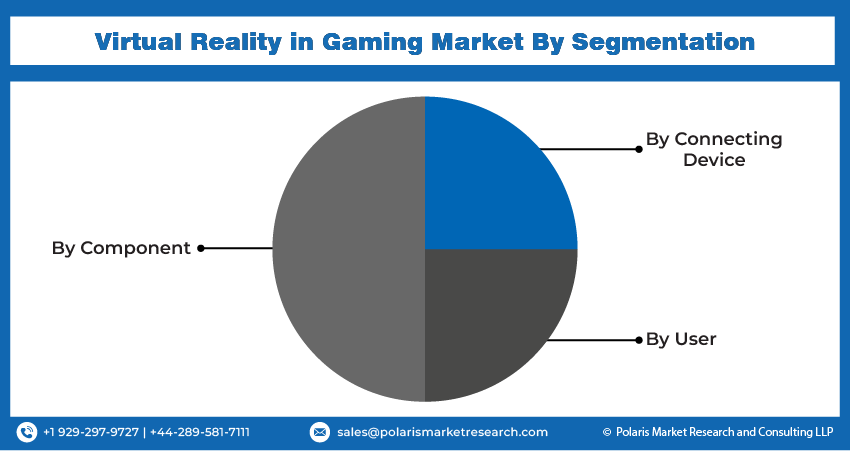
Need Granular Data Across All Market Segments? Request Customization
Regional Insights
By region, the report offers market insights into North America, Europe, Asia-Pacific, Latin America, and the Middle East & Africa. The North America virtual reality in gaming market maintains a dominant position in the global market due to the presence of highly developed technology infrastructure, major technology firms, and game developers, as well as high consumer adoption. The region benefits from the early adoption of premium gaming hardware, a well-established gaming ecosystem for consoles as well as PCs, and the growing availability of exclusive virtual reality content. The expansion of location-based virtual reality gaming centers in major cities is also contributing to the growth of the market. In the U.S., the strong gaming culture, high spending on VR gaming accessories, and the close association between developers and gaming platforms are contributing to the regional market dominance.
The Asia Pacific virtual reality in gaming market is expected to experience a high growth rate during the forecast period. This is due to a growing number of active gamers in the region, which in turn is resulting in a strong demand for more immersive gaming experiences. This is further driven by an increasing number of accessible, affordable devices, a rapid rollout of 5G infrastructure, as well as a growing popularity of Esports and gaming cafes. Countries such as China and Japan are contributing significantly to regional growth. China is benefiting from the large digital gaming population and the growth in VR entertainment centers. Japan is witnessing an increased interest in immersive games based on franchises, social VR content, and themed gaming environments. Such factors are contributing to the growth in VR gaming in the region.
Source: Polaris Market Research Analysis
Curious About Regional Market Performance? Request Customization
Virtual Reality (VR) in Gaming Key Market Players & Competitive Insights
The major companies in this market are investing significantly in R&D activities to increase their product offerings and establish themselves in this industry. This helps them improve their device capabilities and introduce new features. It also contributes to the overall growth of the market.
In addition, competition is no longer limited to just VR headsets. Companies are now trying to offer complete gaming systems, which include devices, software, and game content as well. Market players are trying to differentiate their offerings in terms of exclusive games, better controllers and sensors, software performance, game development support, and game studio partnerships. Hence, companies with good hardware, interesting games, and a well-connected platform are more likely to succeed in the market.
Sony Group Corporation is a multinational company that deals in the design, production, development, and sale of electronic equipment in different markets. The company operates in Japan, Europe, the US, China, and globally. It deals in the distribution of software titles and add-on content via digital networks. It also deals in network services for video content, game content, and music content. The company offers home gaming consoles, packaged and game software, and peripheral devices. Sony launched its second-generation virtual reality headset, PlayStation VR2, in the Indian market in December 2023. The latest headset from Sony is a high-end product that has two OLED displays and offers a fantastic viewing experience in 4K HDR at a high refresh rate of 120 frames per second.
Meta develops technology that helps people connect with others socially and share content through various platforms, including personal computers, mobile devices, wearables, and virtual reality devices, on a global scale. The company operates under two business segments: Family of Apps and Reality Labs. In April 2021, Capcom collaborated with Armature Studio and Oculus Studios (Meta) to bring its game, "Resident Evil 4," into VR, but only for Oculus Quest 2.
List of Key Companies
- Electronic Arts Inc.
- HTC Corporation
- Linden Research, Inc.
- Meta
- Microsoft
- Nintendo
- Qualcomm Technologies, Inc.
- Samsung
- Sony Interactive Entertainment LLC
- Virtuix
VR in Gaming Industry Developments
October 2025: Apple Inc. announced an updated version of its Apple Vision Pro. The updated version is powered by the new M5 chip. According to Apple, the new version provides a better gaming experience. The updated version also offers a longer battery life and faster processing. The update also added support for PlayStation VR2 Sense controllers, which offer advanced motion tracking, finger detection, and haptic feedback for both gaming and professional users.
August 2025: Zero Latency upgraded its VR entertainment centers in Mumbai and Gurgaon to the latest Gen 3 technology. This upgrade provides a wireless VR entertainment experience. It allows users to enjoy a more immersive VR experience through Wi-Fi 6E technology.
June 2023: Meta Platforms announced a subscription-based VR gaming service. The new development allows users to access their games as long as they remain subscribed to Meta Quest+.
VR in Gaming Market Segmentation
By Component Outlook (Revenue, USD Billion, 2021–2034)
- Hardware
- Software
- Content
By Connecting Device Outlook (Revenue, USD Billion, 2021–2034)
- Gaming Console
- PC/Desktop
- Smartphone
By User Outlook (Revenue, USD Billion, 2021–2034)
- Commercial Space
- Individual
By Regional Outlook (Revenue, USD Billion, 2021–2034)
- North America
- US
- Canada
- Europe
- Germany
- France
- UK
- Italy
- Spain
- Netherlands
- Russia
- Rest of Europe
- Asia Pacific
- China
- Japan
- India
- Malaysia
- South Korea
- Indonesia
- Australia
- Vietnam
- Rest of Asia Pacific
- Middle East & Africa
- Saudi Arabia
- UAE
- Israel
- South Africa
- Rest of Middle East & Africa
- Latin America
- Mexico
- Brazil
- Argentina
- Rest of Latin America
VR in Gaming Market Report Scope
| Report Attributes | Details |
| Market Size in 2025 | USD 37.08 billion |
| Market Size in 2026 | USD 44.87 billion |
| Revenue Forecast by 2034 | USD 211.29 billion |
| CAGR | 21.4% |
| Base Year | 2025 |
| Historical Data | 2021–2024 |
| Forecast Period | 2026–2034 |
| Quantitative Units | Revenue in USD billion, and CAGR from 2026 to 2034 |
| Report Coverage | Revenue Forecast, Market Competitive Landscape, Growth Factors, and Trends |
| Segments Covered |
|
| Regional Scope |
|
| Competitive Landscape | VR in Gaming Industry Trend Analysis (2025) Company profiles/industry participants profiling include company overview, financial information, product/service benchmarking, and recent developments |
| Report Format | PDF + Excel |
| Customization | Report customization as per your requirements with respect to countries, regions, and segmentation. |
Source: Polaris Market Research Analysis
Virtual Reality in Gaming Market FAQ's
The VR in gaming market stood at USD 37.08 billion in 2025. The market is projected to reach USD 211.29 billion by 2034.
The market is projected to account for a CAGR of 21.4% between 2026 and 2034.
The market is driven by the rising demand for immersive gaming experiences and widespread adoption of VR headsets.
The hardware segment led the virtual reality in gaming market in 2025. This is due to its importance in enabling immersive experiences in virtual reality gaming.
North America leads the market for VR in gaming. The regional market is supported by strong technology infrastructure and high consumer spending.
The gaming console segment holds the largest share, led by widespread adoption of systems like Sony's PlayStation VR2, due to its accessibility and plug-and-play VR compatibility.
5G enables low-latency, high-bandwidth connectivity essential for seamless VR gaming. It is a key growth driver especially in Asia Pacific, boosting adoption in countries like China and Japan.
Download Sample Report of Virtual Reality in Gaming Market
Please fill out the form to request a customized copy of the research report.
