
Chemical Distribution Market Size, Share Global Analysis Report, 2025-2034
REPORT DETAILS
Market Statistics
Overview
The global chemical distribution market size was valued at USD 265.15 billion in 2024, growing at a CAGR of 7.26% from 2025–2034. Key factors driving demand includes value-added services (VAS), regulatory complexity and compliance, outsourcing of supply chain functions, and rising demand for specialty chemicals.
Key Insights
- In 2024, commodity chemicals held a dominant 63.7% revenue share, driven by their high-volume use in bulk industrial, agricultural, and construction applications.
- The downstream chemicals segment is projected to be the fastest-growing, with a 7.3% CAGR, due to its essential role in creating derivatives for numerous industries.
- North America held a substantial global market share in 2024, supported by its robust industrial base, advanced infrastructure, and major distributor presence.
- The U.S. led the North America market in 2024, fueled by its diverse industrial sector and high chemical demand from pharmaceuticals, oil and gas, and manufacturing.
- Asia Pacific captured the largest global revenue share at 62.2% in 2024, driven by rapid industrialization, manufacturing expansion, and swift urbanization.
- China's market is growing rapidly due to booming manufacturing, increasing urbanization, and strong chemical demand from its construction, electronics, and automotive sectors.
Industry Dynamics
- Companies are outsourcing complex logistics and storage to specialized chemical distributors to ensure regulatory compliance and focus on their core operations.
- The growing need for specialty chemicals, which require tailored handling and technical expertise, is further accelerating this market expansion.
- Navigating persistent global supply chain disruptions and strict evolving regulatory landscapes increases operational complexity and costs for distributors.
- The rising demand for specialty chemicals and value-added services like technical support presents a new avenue for revenue growth and market differentiation.
Market Statistics
- 2024 Market Size: USD 265.15 billion
- 2034 Projected Market Size: USD 533.87 billion
- CAGR (2025-2034): 7.26%
- Asia Pacific: Largest market in 2024
AI Impact on Chemical Distribution Market
- AI algorithms analyze traffic and weather to create the most efficient, cost-effective delivery routes, saving time and fuel.
- It predicts future customer demand more accurately, optimizing inventory levels and reducing both shortages and excess stock.
- AI monitors operations in real-time to predict potential safety hazards and ensure strict adherence to complex regulatory standards.
- AI-powered tools provide tailored product recommendations and proactive support, enhancing the customer experience and strengthening relationships.
The chemical distribution is the structured supply chain network that facilitates the safe storage, handling, and delivery of chemicals across industries, and is strongly influenced by the growing focus on value-added services (VAS). Beyond basic logistics, distributors are increasingly offering technical support, formulation advice, packaging customization, and warehouse management systems, which enhance their role as strategic partners rather than just intermediaries. For instance, in March 2023, global chemical distributor Brenntag acquired Aik Moh Group, a Southeast Asian specialist known for its industrial chemical blending, last-mile delivery, and value-added logistics services. This shift enables manufacturers and end-users to streamline operations, reduce costs, and gain efficiency while ensuring the timely and precise delivery of specialty chemical needs. Thus, as industries become more complex and demand tailored solutions, the provision of VAS strengthens long-term relationships and creates differentiation in a competitive market environment.
Source: Polaris Market Research Analysis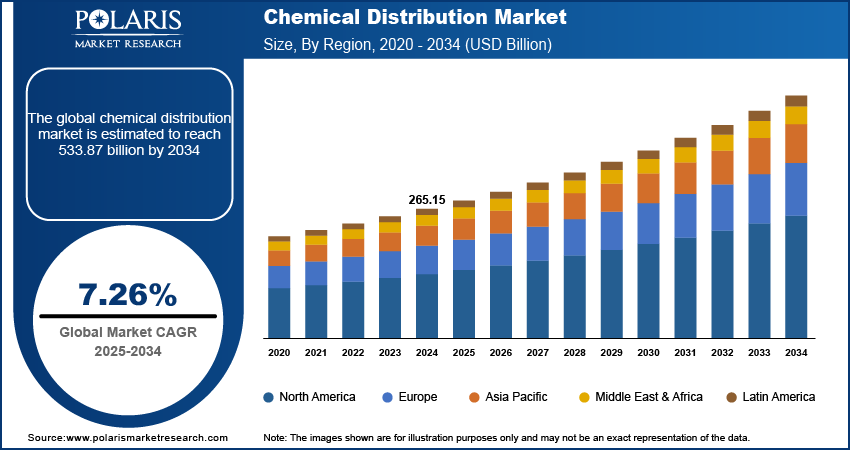
Want a Deeper Look at Key Market Players? Download Sample Report
The rising regulatory complexity and the need for strict compliance across regions further contribute to the growth opportunities. Distributors have a crucial role in ensuring compliance with international and domestic regulations, as evolving frameworks govern chemical safety, environmental impact, and transportation standards. They help manufacturers and end-users mitigate risks while maintaining operational continuity by managing documentation, certifications, labeling, and safety protocols. This role elevates their importance in the value chain, as compliance is both a legal obligation and a critical factor in building trust and safeguarding the brand reputation. In this way, regulatory complexity enables greater reliance on distributors as trusted partners for navigating a strict and dynamic regulatory landscape.
Drivers & Opportunities
Outsourcing of Supply Chain Functions: The outsourcing of supply chain functions is driving demand for chemical distribution, as companies increasingly rely on distributors to manage logistics, storage, and delivery complexities. Handling chemicals requires specialized infrastructure, safety compliance, and efficient coordination, which can be resource-intensive for manufacturers to manage independently. Companies focus on their core operations while ensuring that their chemical supply chain is managed with precision and regulatory adherence by outsourcing these functions. For instance, in February 2025, Wagner Logistics partnered with an agricultural chemical company to provide specialized warehousing and distribution services for its complex, high-value products. This reliance on distributors enhances efficiency, reduces operational risks, and enables scalability, thereby strengthening the overall demand for chemical distribution services.
Demand for Specialty Chemicals: The rising demand for specialty chemicals is also driving the market expansion, as these products often require customized handling, technical expertise, and tailored delivery solutions. Specialty chemicals are widely used across sectors, such as pharmaceuticals, automotive, and electronics, where quality consistency and application-specific properties are essential. Distributors play a vital role in bridging the gap between producers and end-users by offering formulation support, smaller-volume distribution, and compliance with strict safety standards. This trend highlights the essential role of chemical distributors in meeting niche demands, driving innovation, and ensuring the accessibility of specialty products across diverse regional markets.
Source: Polaris Market Research Analysis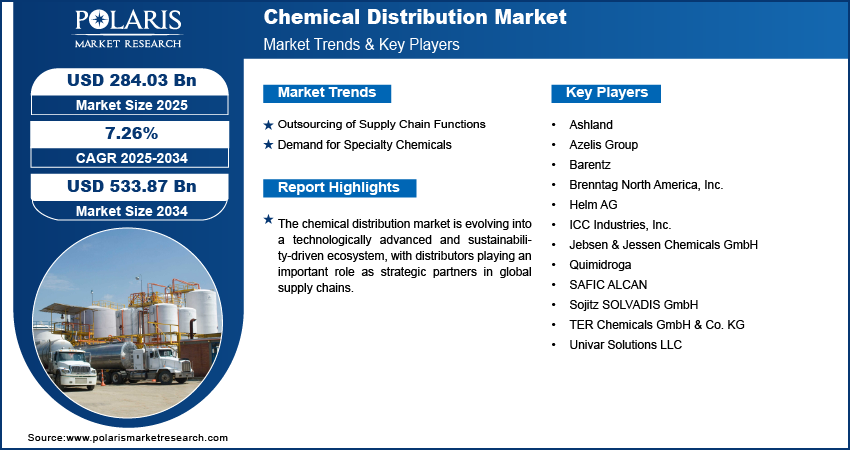
Get Full Segment-Level Forecasts & Insights: Download Sample Report
Segmental Insights
Type Analysis
Based on type, the segmentation includes specialty chemicals, commodity chemicals. The commodity chemicals segment accounted for 63.7% revenue share in 2024, primarily due to their widespread use in bulk applications across various industries, such as construction, agriculture, and manufacturing. These chemicals form the backbone of large-scale industrial processes, ensuring consistent demand from multiple sectors. Their standardized formulations, high-volume consumption, and cost-efficiency drive their dominance in the distribution landscape. Furthermore, established global trade networks and well-developed supply chains for commodity chemicals contribute to their substantial market share, making them an essential segment within the chemical distribution industry.
End Use Analysis
In terms of end use, the segmentation includes specialty chemicals, commodity chemicals. Under the commodity chemicals, downstream chemicals segment is expected to witness fastest growth at a CAGR of 7.3% during the forecast period due to its essential role in producing derivatives that serve multiple industries. Downstream chemicals, such as plastics, resins, and synthetic materials, are in high demand as they serve as raw materials for various sectors, such as packaging, automotive, and consumer goods. The growing focus on value-chain integration and the expanding demand for processed chemical derivatives further enhance the growth prospects of this segment. Therefore, as industries continue to rely on versatile chemical inputs, the downstream chemicals segment is expected to emerge substantially for future expansion in distribution.
Source: Polaris Market Research Analysis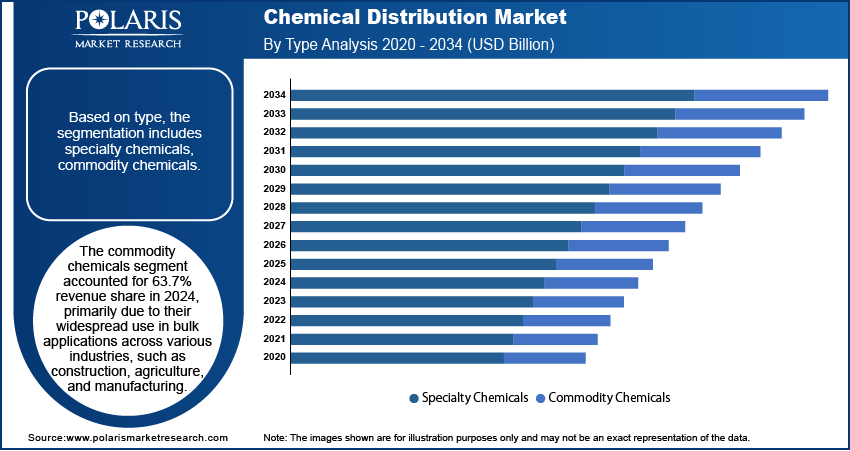
Need Granular Data Across All Market Segments? Request Customization
Regional Analysis
North America chemical distribution market accounted for substantial global market share in 2024. This dominance is attributed to the region’s strong industrial base, well-established supply chain infrastructure, and the presence of leading global distributors. The region benefits from high demand across diverse end-use sectors, such as pharmaceuticals, oil and gas, and advanced manufacturing, which ensures stable distribution opportunities. An October 2024 American Chemistry Council report found that more than 50% of U.S. chemical exports are petrochemicals and their derivatives, including plastic resins. Furthermore, strict safety and compliance standards in North America boost the role of distributors as essential partners in navigating regulatory frameworks. These factors collectively reinforce North America’s position on a global scale.
U.S. Chemical Distribution Market Insight
U.S. held significant market share in North America chemical distribution landscape in 2024 due to its diversified industrial base and high demand for chemicals across sectors such as pharmaceuticals, oil and gas, and advanced manufacturing. Strong infrastructure, combined with a highly regulated compliance environment, positions distributors as essential partners in ensuring the efficient and safe supply of chemicals. Additionally, the presence of leading global distributors and a strong focus on technological integration in logistics enhances the market’s competitiveness.
Asia Pacific Chemical Distribution Market
The market in Asia Pacific accounted for the largest revenue share of 62.2% in 2024 driven by its expanding industrial activities, growing manufacturing base, and rapid urbanization. The region’s dominance is driven by rising investment in chemicals in industries such as construction, electronics, and automotive, supported by large-scale infrastructure development. For instance, in November 2024, tech-driven chemical distributor Elchemy secured USD 5.6 million in funding to enhance its technological platform and support its global expansion. Distributors in this region benefit from strong demand for both specialty and commodity chemicals, driven by population growth and evolving consumer needs. Additionally, increasing investments in industrial expansion and the availability of cost-effective labor enhance the efficiency of chemical distribution networks, making the Asia Pacific the largest regional market.
China Chemical Distribution Market Overview
The market in China is expanding due to the rapid growth of manufacturing industries, rising urbanization, and strong demand for chemicals in construction, electronics, and automotive sectors. A large domestic consumer base, combined with increasing investments in industrial development, drives effective distribution opportunities. Moreover, the push for modernization of supply chains and the adoption of digital platforms for logistics management further support the growth of chemical distribution in the country.
Europe Chemical Distribution Market
The chemical distribution landscape in Europe is projected to hold a substantial share in 2034 driven by the region’s well-structured regulatory environment, advanced industrial sectors, and strong focus on sustainability. European distributors play a crucial role in ensuring compliance with strict environmental and safety standards while maintaining a reliable supply of chemicals to industries such as automotive, energy, and healthcare. The market also benefits from a growing shift toward green chemistry and circular economy practices, which increase the importance of specialized distribution services. This focus on innovation, combined with Europe’s diversified industrial base, positions the region as a steady and influential participant in the global market.
Germany Chemical Distribution Market
The Germany market is driven by its strong industrial capabilities, advanced chemical manufacturing sector, and a clear focus on sustainability and compliance with strict regulations. German distributors are recognized for their technical expertise and ability to provide value-added services such as formulation support and customized packaging. Furthermore, the country’s focus on green chemistry and circular economy practices enhances demand for specialized distribution solutions, reinforcing Germany’s role within the European landscape.
Source: Polaris Market Research Analysis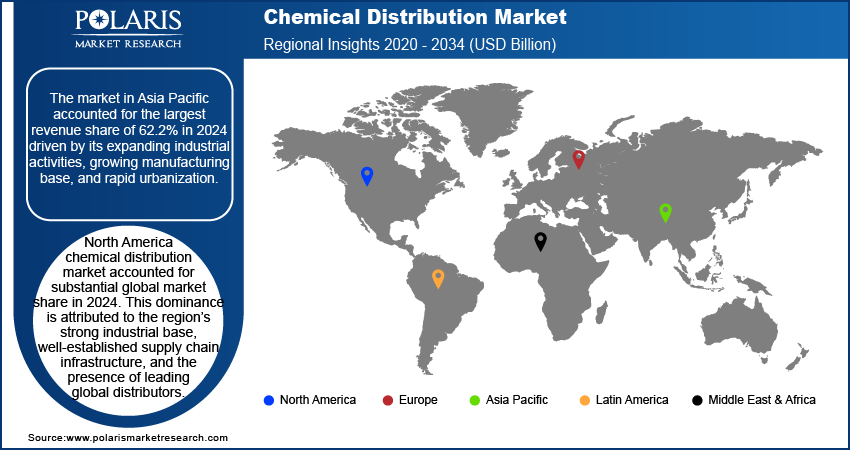
Curious About Regional Market Performance? Request Customization
Key Players & Competitive Analysis Report
The chemical distribution industry is navigating substantial economic and geopolitical shifts, as well as supply chain disruptions, which create both challenges and opportunities for revenue growth. Competitive intelligence and strategy are crucial; as emerging markets present the strongest expansion opportunities for growth. Success relies on strategic investments in technology and logistics to build sustainable value chains. For small and medium-sized businesses, differentiating themselves through the insight and technical support of specialized experts is a future development strategy. The future of industry ecosystems will be defined by agility and the ability to leverage technological advancement to meet evolving latent demand and opportunities.
Major companies operating in the chemical distribution industry include Ashland; Azelis Group; Barentz; Brenntag North America, Inc.; Helm AG; ICC Industries, Inc.; Jebsen & Jessen Chemicals GmbH; Quimidroga; SAFIC ALCAN; Sojitz SOLVADIS GmbH; TER Chemicals GmbH & Co. KG; and Univar Solutions LLC.
Key Players
- Ashland
- Azelis Group
- Barentz
- Brenntag North America, Inc.
- Helm AG
- ICC Industries, Inc.
- Jebsen & Jessen Chemicals GmbH
- Quimidroga
- SAFIC ALCAN
- Sojitz SOLVADIS GmbH
- TER Chemicals GmbH & Co. KG
- Univar Solutions LLC
Industry Developments
-
In January 2026, ChemCeed expanded its product portfolio to include rubber accelerators and antioxidants through a partnership with PMI.
-
In November 2025, Lindsay Goldberg agreed to acquire EMCO Chemical Distributors, a Wisconsin-based supplier of over 5,000 chemical products, strengthening capabilities in distribution, blending, and packaging across multiple industries.
-
In October 2025, IMCD N.V., a global leader in specialty chemicals distribution and formulation, acquired 100% of Dong Yang FT Corp. in South Korea, strengthening its local presence and expanding its beauty and personal care portfolio.
-
In September 2025, European private equity firm Hivest Capital, along with its partner S.A.S., acquired a stake in Novasol Chemicals to support the company’s international expansion and growth strategy.
-
In March 2025, Sea-Land Chemical Company partnered with Evonik to distribute Evonik’s advanced, eco-friendly cleaning solutions across the US, expanding Sea-Land’s product range and supporting both companies’ commitment to sustainability and innovation in the cleaning industry.
- In March 2025, ChemSpec Canada a subsidiary of Safic-Alcan and AFCONA Additives collaborated to provide ChemSpec's Canadian customers with access to AFCONA's specialty additive product portfolio for coatings and other applications.
Chemical Distribution Market Segmentation
By Type Outlook (Revenue, USD Billion, 2020–2034)
- Specialty Chemicals
- CASE
- Agrochemicals
- Electronic
- Construction
- Specialty Polymers & Resins
- Personal Care & Pharmaceuticals
- Other
- Commodity Chemicals
- Plastic & Polymers
- Synthetic Rubber
- Explosives
- Petrochemicals
- Other
By End Use Outlook (Revenue, USD Billion, 2020–2034)
- Specialty Chemicals
- Automotive & Transportation
- Construction
- Agriculture
- Industrial Manufacturing
- Consumer Goods
- Textiles
- Pharmaceuticals
- Other
- Commodity Chemicals
- Downstream Chemicals
- Textiles
- Electrical & Electronics
- Automotive & Transportation
- Industrial Manufacturing
- Others
By Regional Outlook (Revenue, USD Billion, 2020–2034)
- North America
- US
- Canada
- Europe
- Germany
- France
- UK
- Italy
- Spain
- Netherlands
- Russia
- Rest of Europe
- Asia Pacific
- China
- Japan
- India
- Malaysia
- South Korea
- Indonesia
- Australia
- Vietnam
- Rest of Asia Pacific
- Middle East & Africa
- Saudi Arabia
- UAE
- Israel
- South Africa
- Rest of Middle East & Africa
- Latin America
- Mexico
- Brazil
- Argentina
- Rest of Latin America
Chemical Distribution Market Report Scope
| Report Attributes | Details |
| Market Size in 2024 | USD 265.15 Billion |
| Market Size in 2025 | USD 284.03 Billion |
| Revenue Forecast by 2034 | USD 533.87 Billion |
| CAGR | 7.26% from 2025 to 2034 |
| Base Year | 2024 |
| Historical Data | 2020–2023 |
| Forecast Period | 2025–2034 |
| Quantitative Units | Revenue in USD Billion and CAGR from 2025 to 2034 |
| Report Coverage | Revenue Forecast, Competitive Landscape, Growth Factors, and Industry Trends |
| Segments Covered |
|
| Regional Scope |
|
| Competitive Landscape |
|
| Report Format |
|
| Customization | Report customization as per your requirements with respect to countries, regions, and segmentation. |
Source: Polaris Market Research Analysis
Chemical Distribution Market FAQ's
The global market size was valued at USD 265.15 billion in 2024 and is projected to grow to USD 533.87 billion by 2034.
The global market is projected to register a CAGR of 7.26% during the forecast period.
The market in Asia Pacific accounted for the largest revenue share of 62.2% in 2024.
A few of the key players in the market are Ashland; Azelis Group; Barentz; Brenntag North America, Inc.; Helm AG; ICC Industries, Inc.; Jebsen & Jessen Chemicals GmbH; Quimidroga; SAFIC ALCAN; Sojitz SOLVADIS GmbH; TER Chemicals GmbH & Co. KG; and Univar Solutions LLC.
The commodity chemicals segment accounted for 63.7% revenue share in 2024.
Under the commodity chemicals, downstream chemicals segment is expected to witness fastest growth at a CAGR of 7.3% during the forecast period.
Under the commodity chemicals, downstream chemicals segment is expected to witness fastest growth at a CAGR of 7.3% during the forecast period.
Download Sample Report of Chemical Distribution Market
Please fill out the form to request a customized copy of the research report.
